Where to find this metric
Go to Revenue → Metrics → Net Revenue in your Memberful dashboard.What is net revenue?
Revenue is the total amount your business earns from sales. Net revenue is your total sales revenue minus refunds and member discounts. It represents the actual amount you keep from sales before any operating expenses (e.g., software costs, production expenses, or team costs). Net revenue is important because refunds and discounts can meaningfully change your monthly earnings — and understanding these changes helps you make informed pricing and product decisions.How is Net Revenue calculated?
Here’s how we calculate the Net Revenue metric:Net Revenue = Total Revenue - Refunds - Discounts
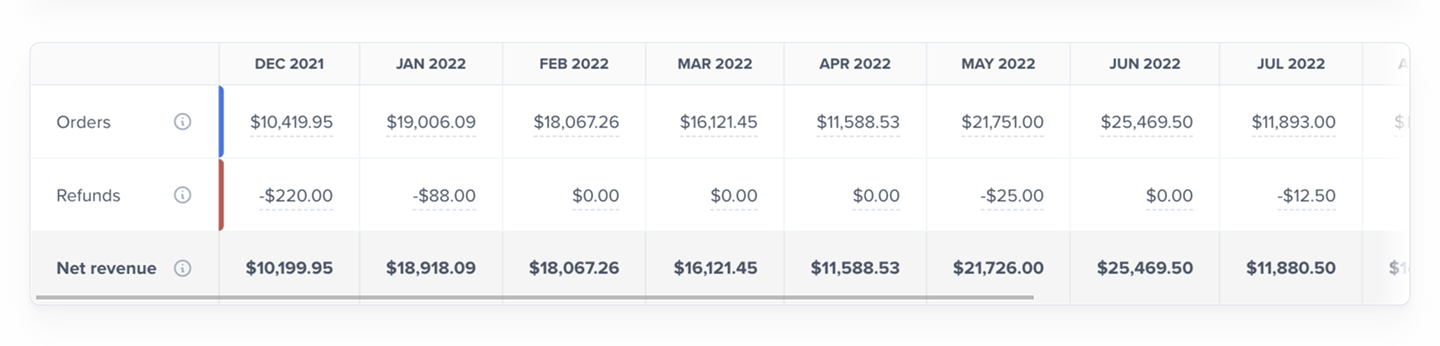
We calculate Net Revenue by subtracting all refunds and membership discounts from your total revenue (orders).
Metrics update daily at midnight UTC and reflect the previous calendar day.
What affects my Net Revenue?
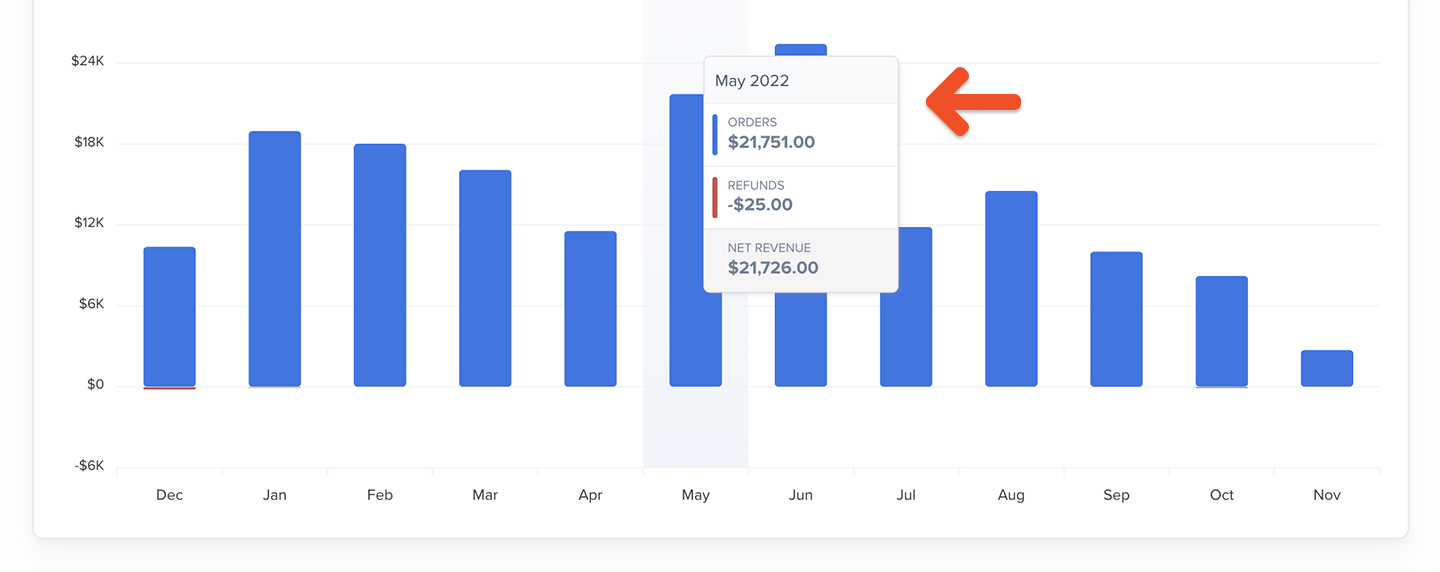
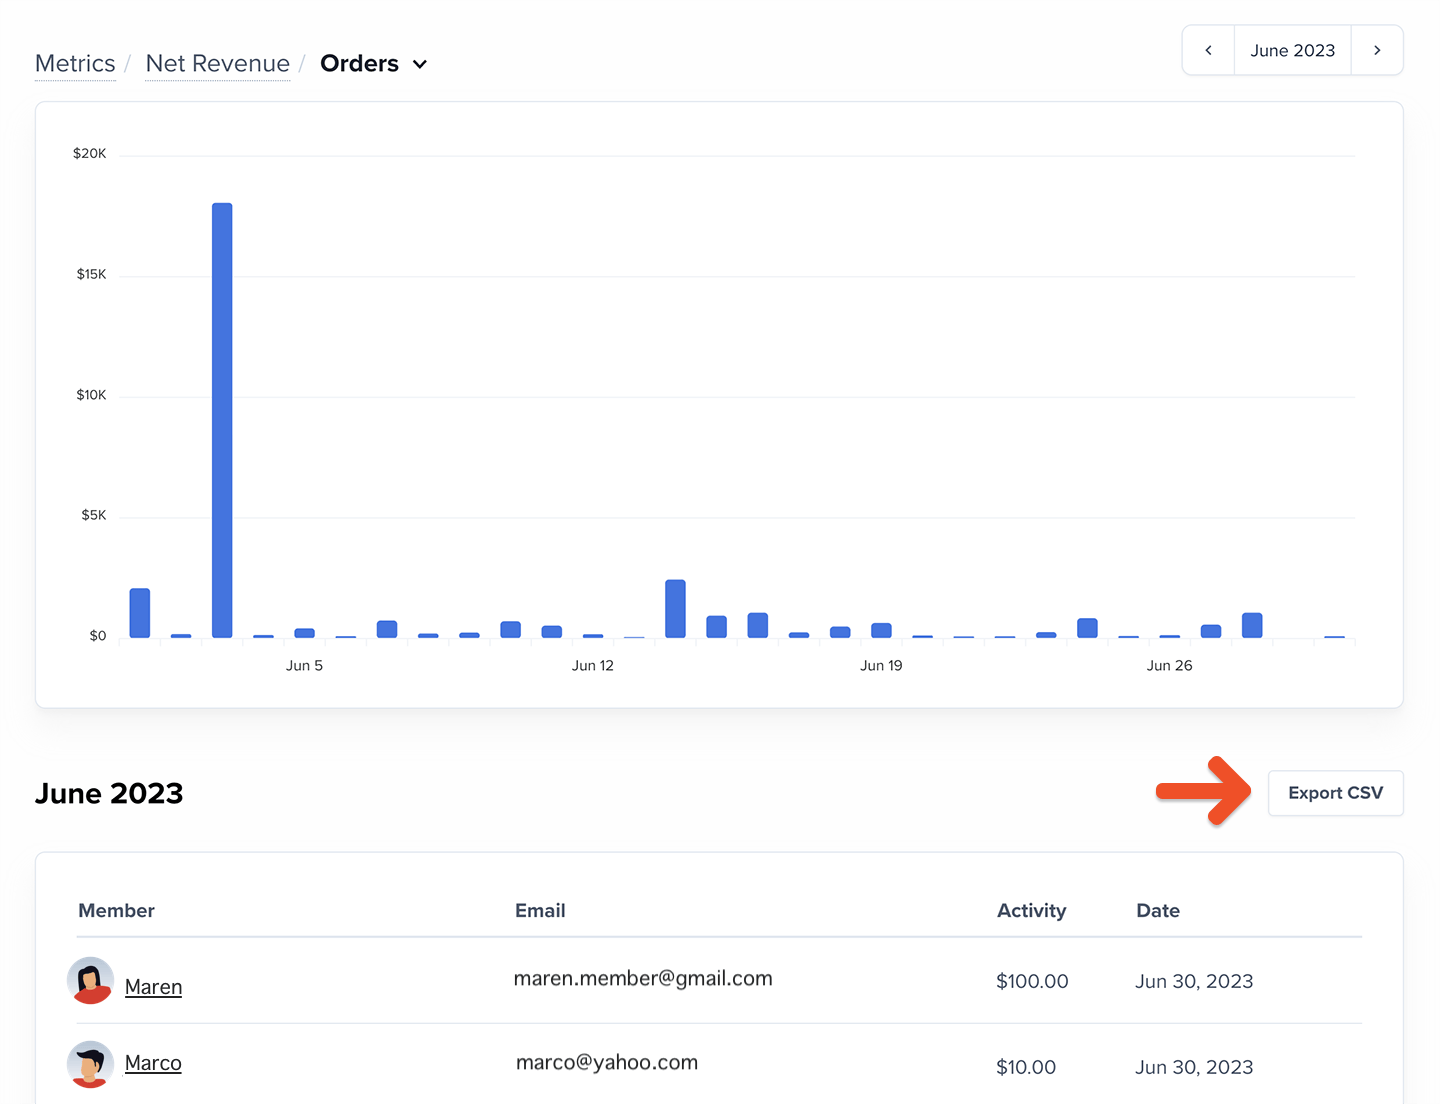
These activities affect your Net Revenue:- Orders: Revenue from all recurring and one-time payments
- Refunds: Revenue lost due to full or partial refunds
- Discounts: Revenue reduced by coupon codes, membership discounts, or promotional pricing
How to explore your Net Revenue data
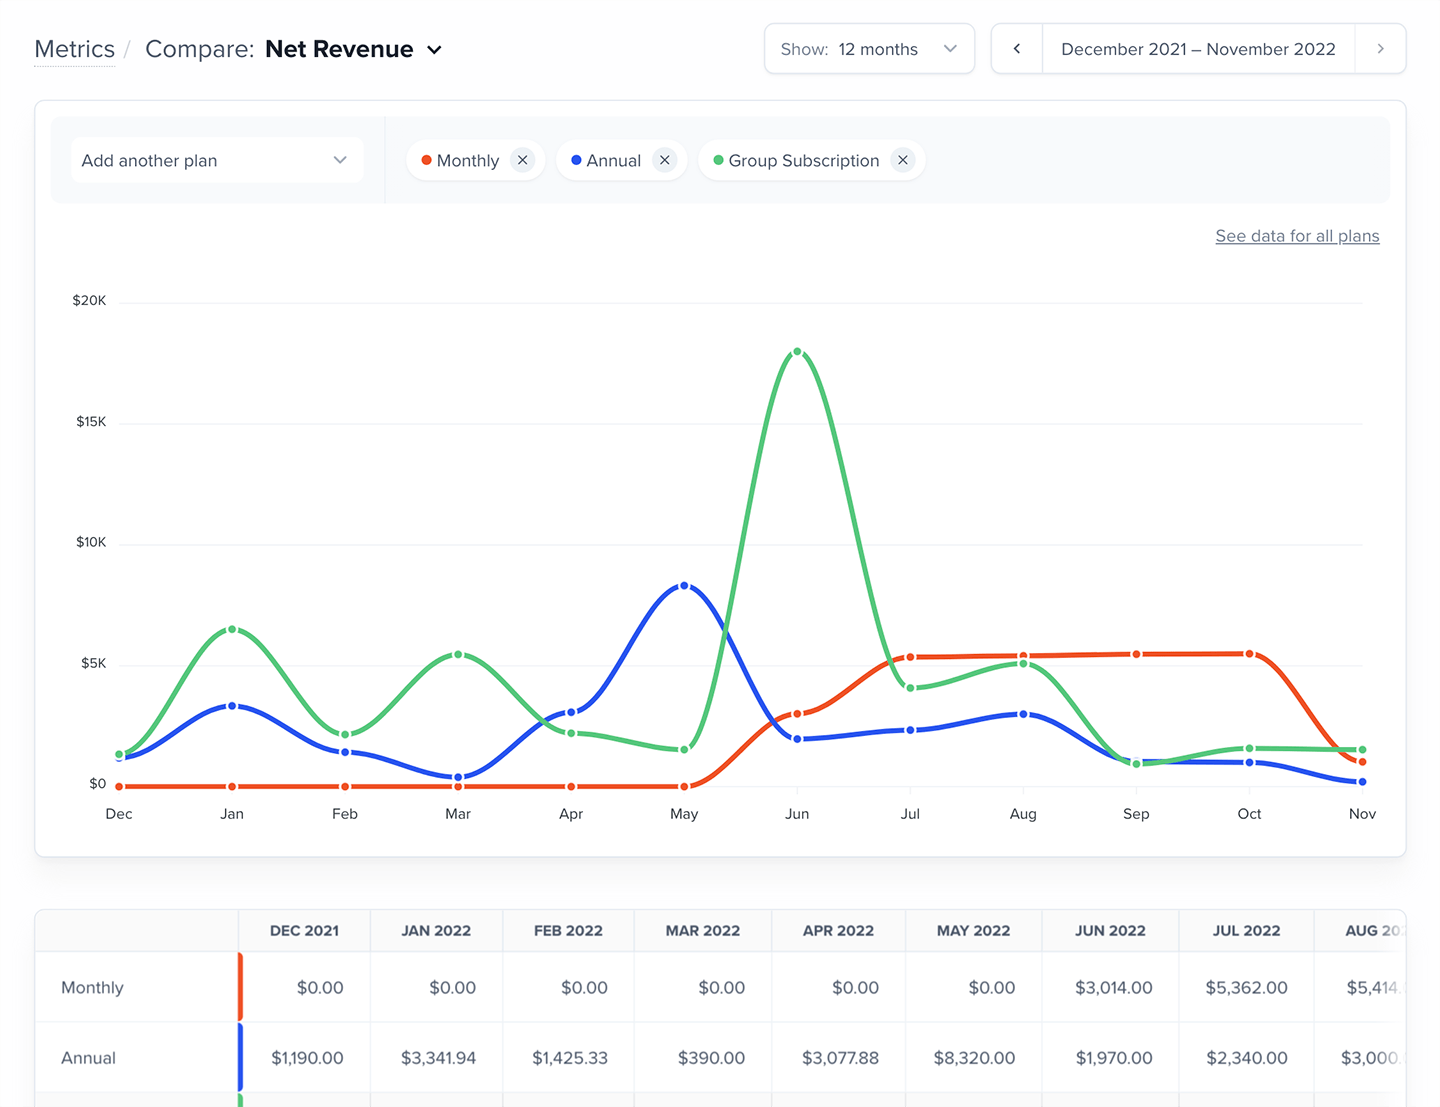
The Net Revenue chart displays your monthly totals, including the current (partially complete) month. It defaults to the last 12 months, but you can switch to the last 3 or 6 months, or scroll forward and backward through time.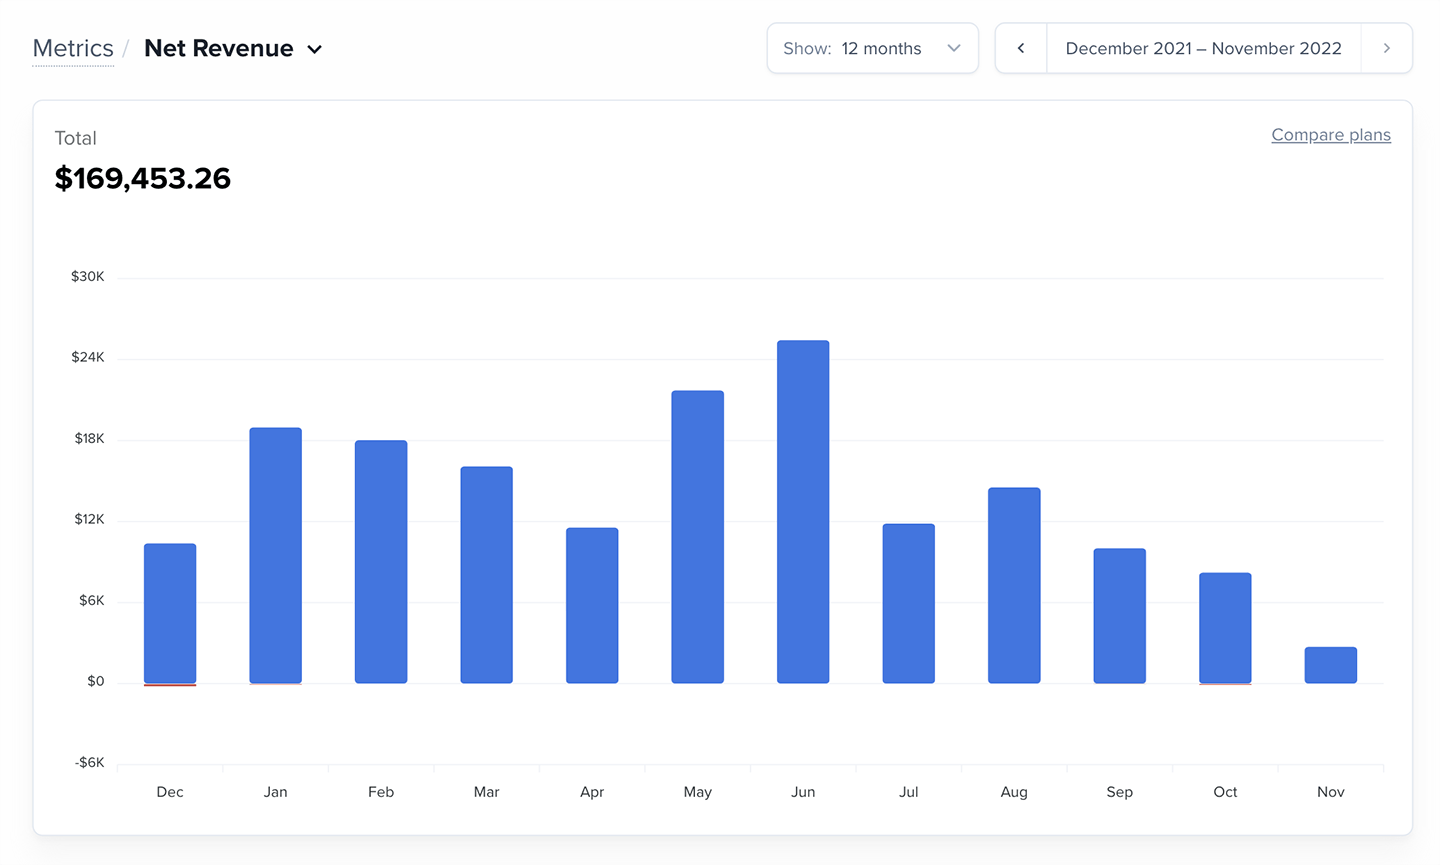
Want to compare Net Revenue across plans? Learn more.
How should I use this metric?
Net Revenue gives you a clearer picture of your true earnings after refunds and discounts — which is essential for understanding how your business is performing month over month. From here, you can subtract additional operating expenses to calculate your net profit, or use Net Revenue to track your profit margins over time. A few patterns to monitor:- Net revenue trending upward: Your earnings are growing and discounts/refunds are under control
- Net revenue trending downward: Refunds, discounts, or pricing issues may be eating up your earnings
- A shift lasting 3+ months: A sustained trend worth investigating