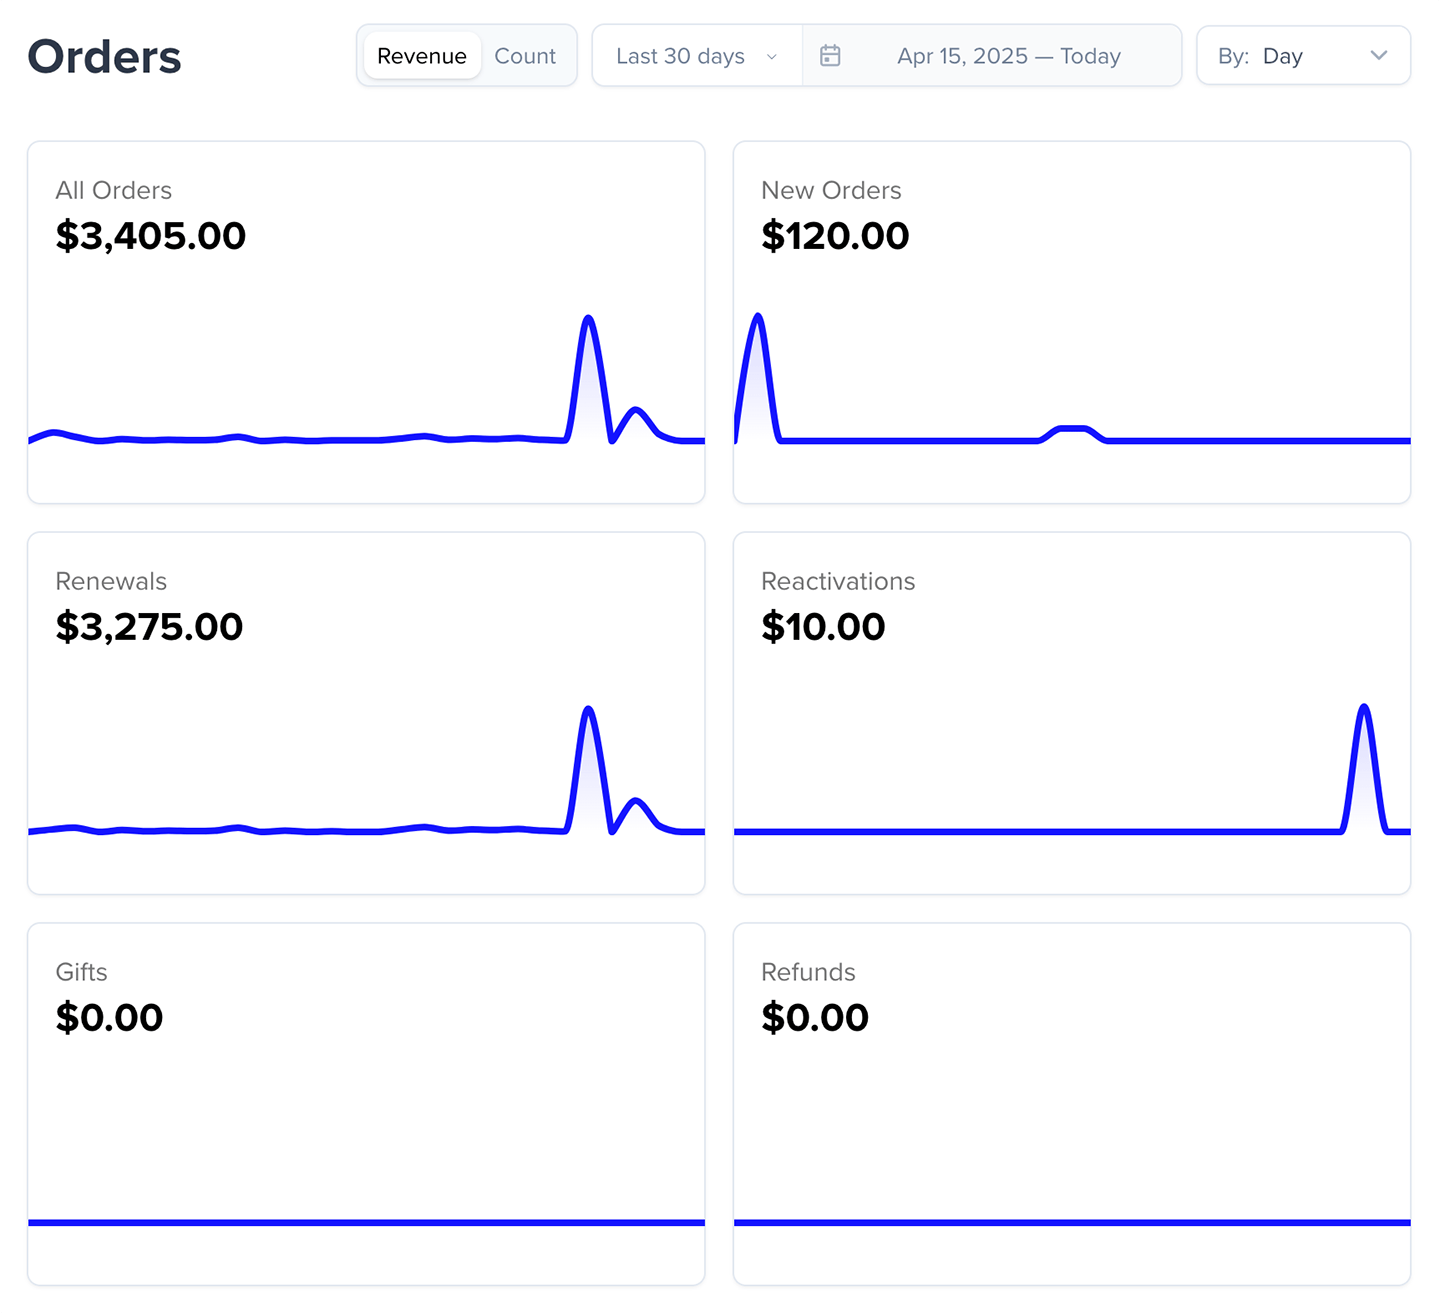
Where to find order data
Go to Revenue → Orders to open the Orders overview page. The overview shows charts for:- All Orders
- New Orders
- Renewals
- Reactivations
- Gifts
- Refunds
How order data updates
Order charts refresh in two ways:- Daily historical update: Yesterday’s data is added once per day at 00:00 UTC (7PM EST / 4PM PST).
- Same-day updates: Today’s data refreshes throughout the day, but only when you open an individual chart page.
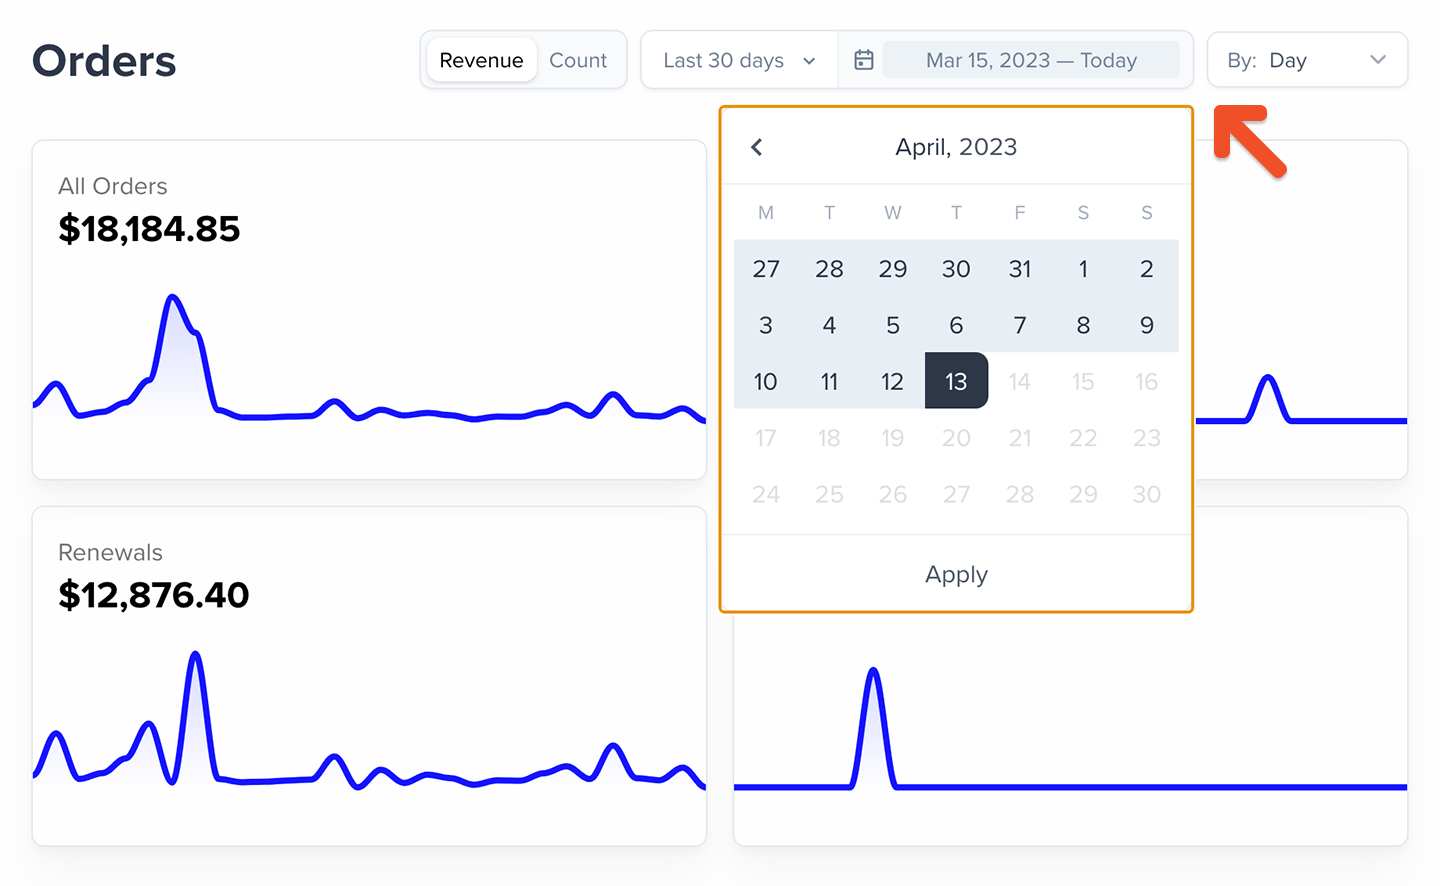
Filtering and viewing options
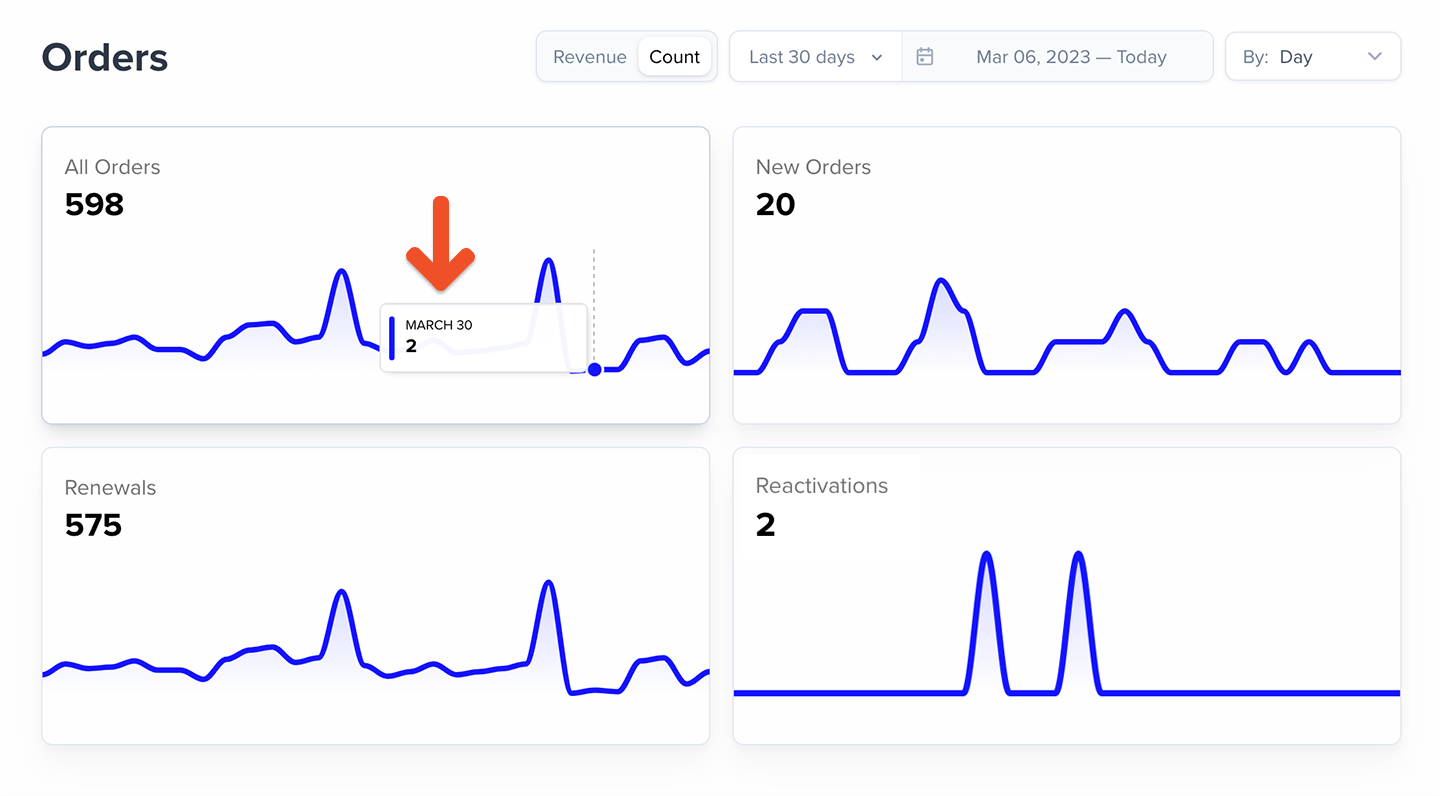
Switch between Count and Revenue to change how your chart data is displayed.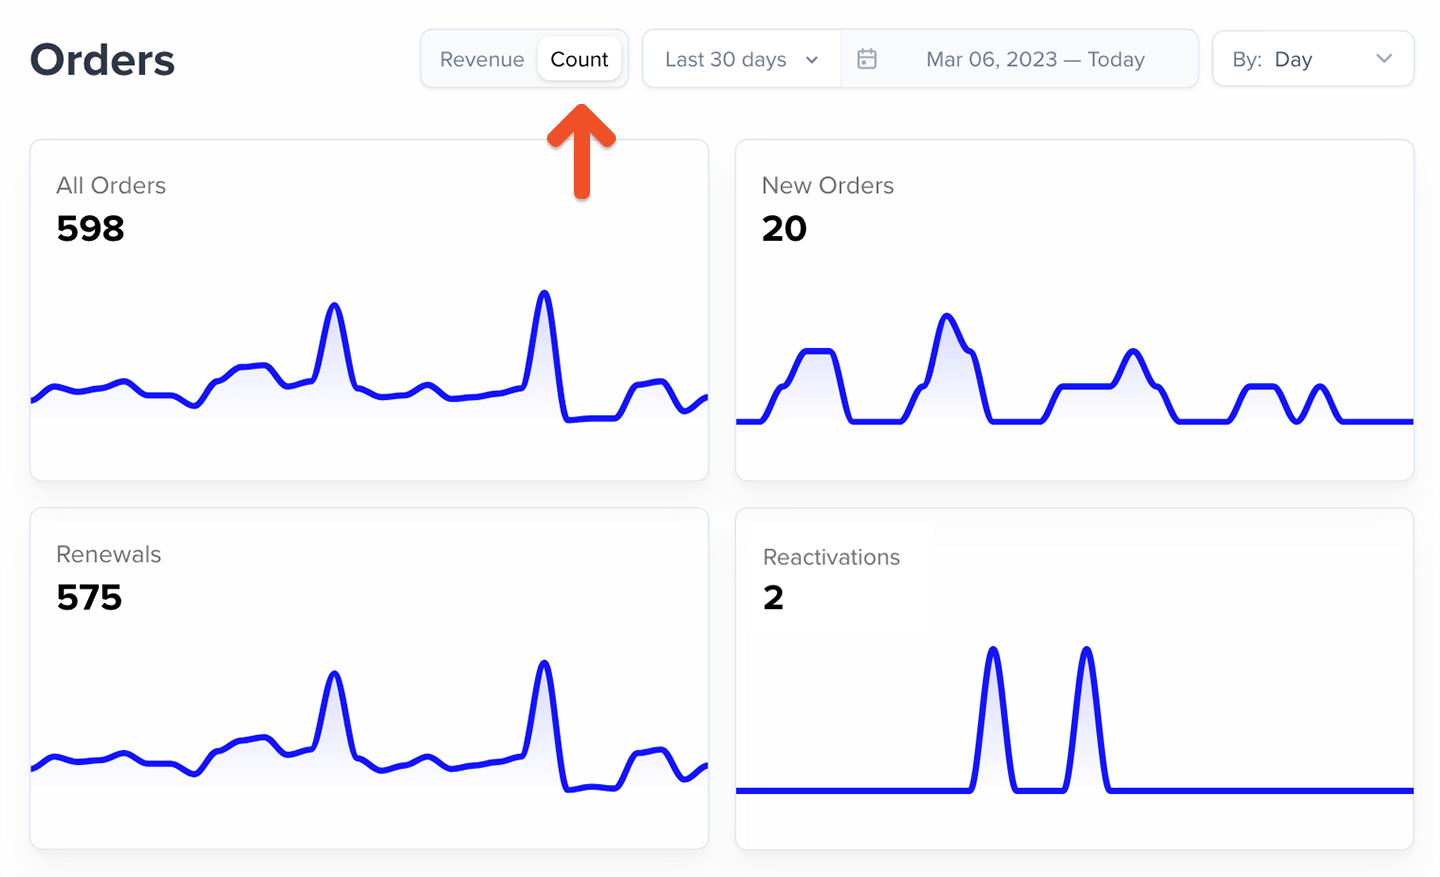
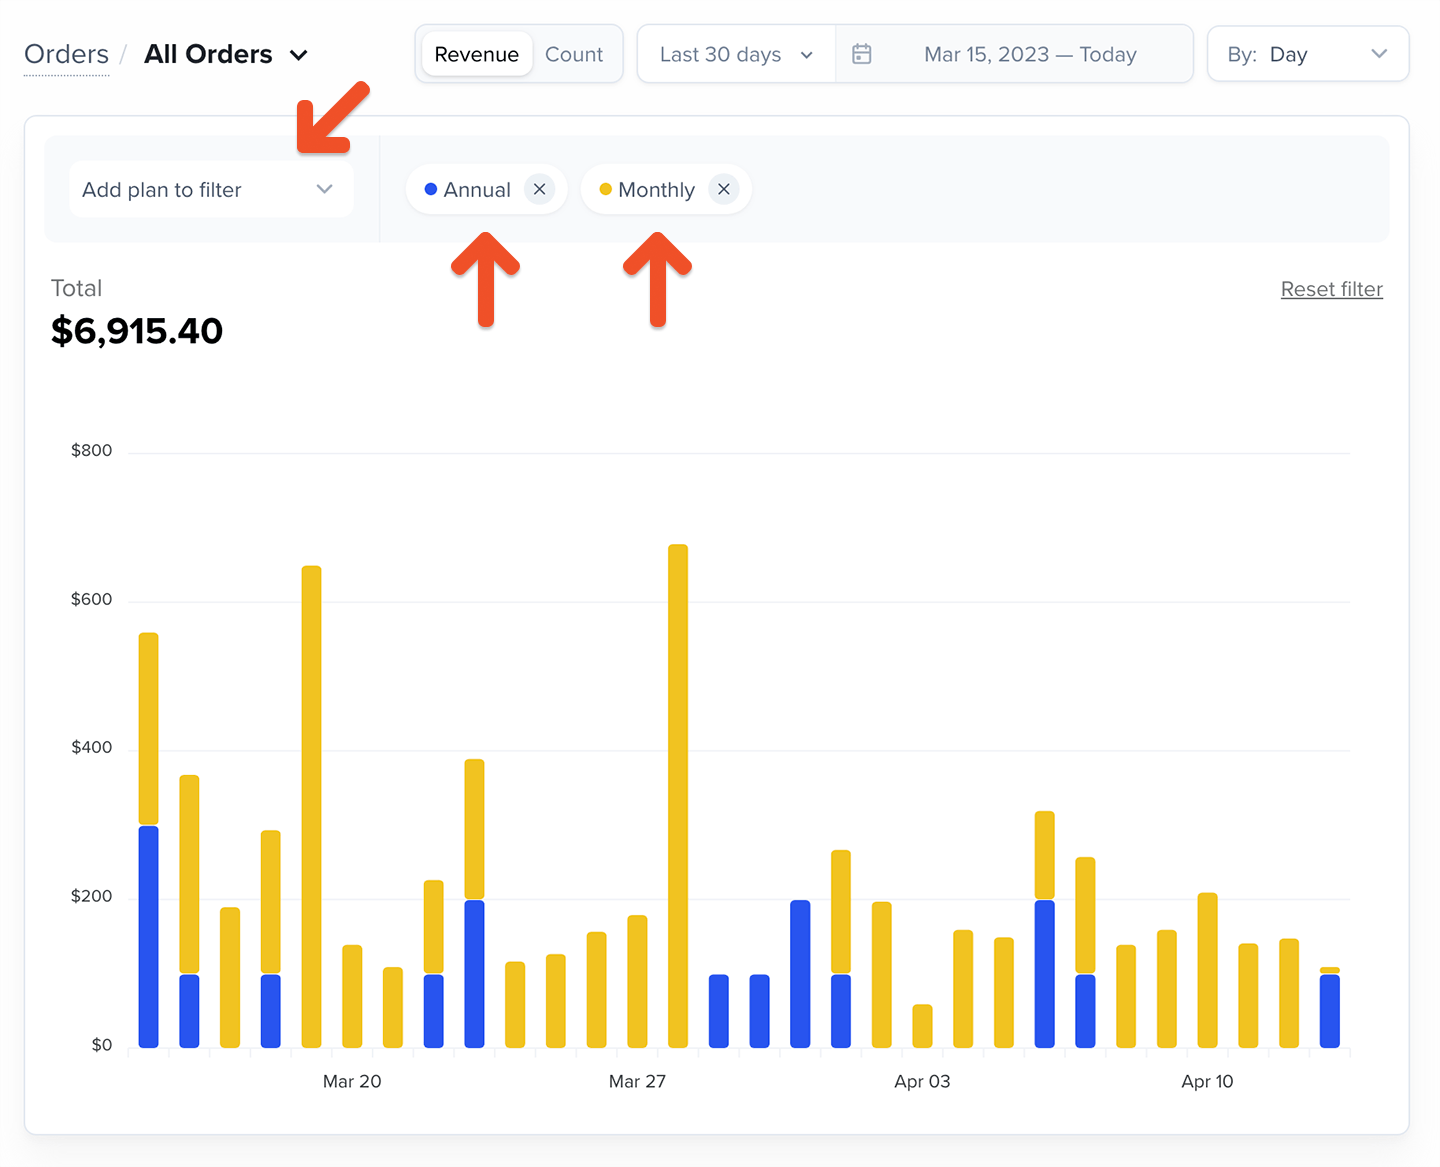
Charts on the Orders overview page always show data for all plans.
Order types
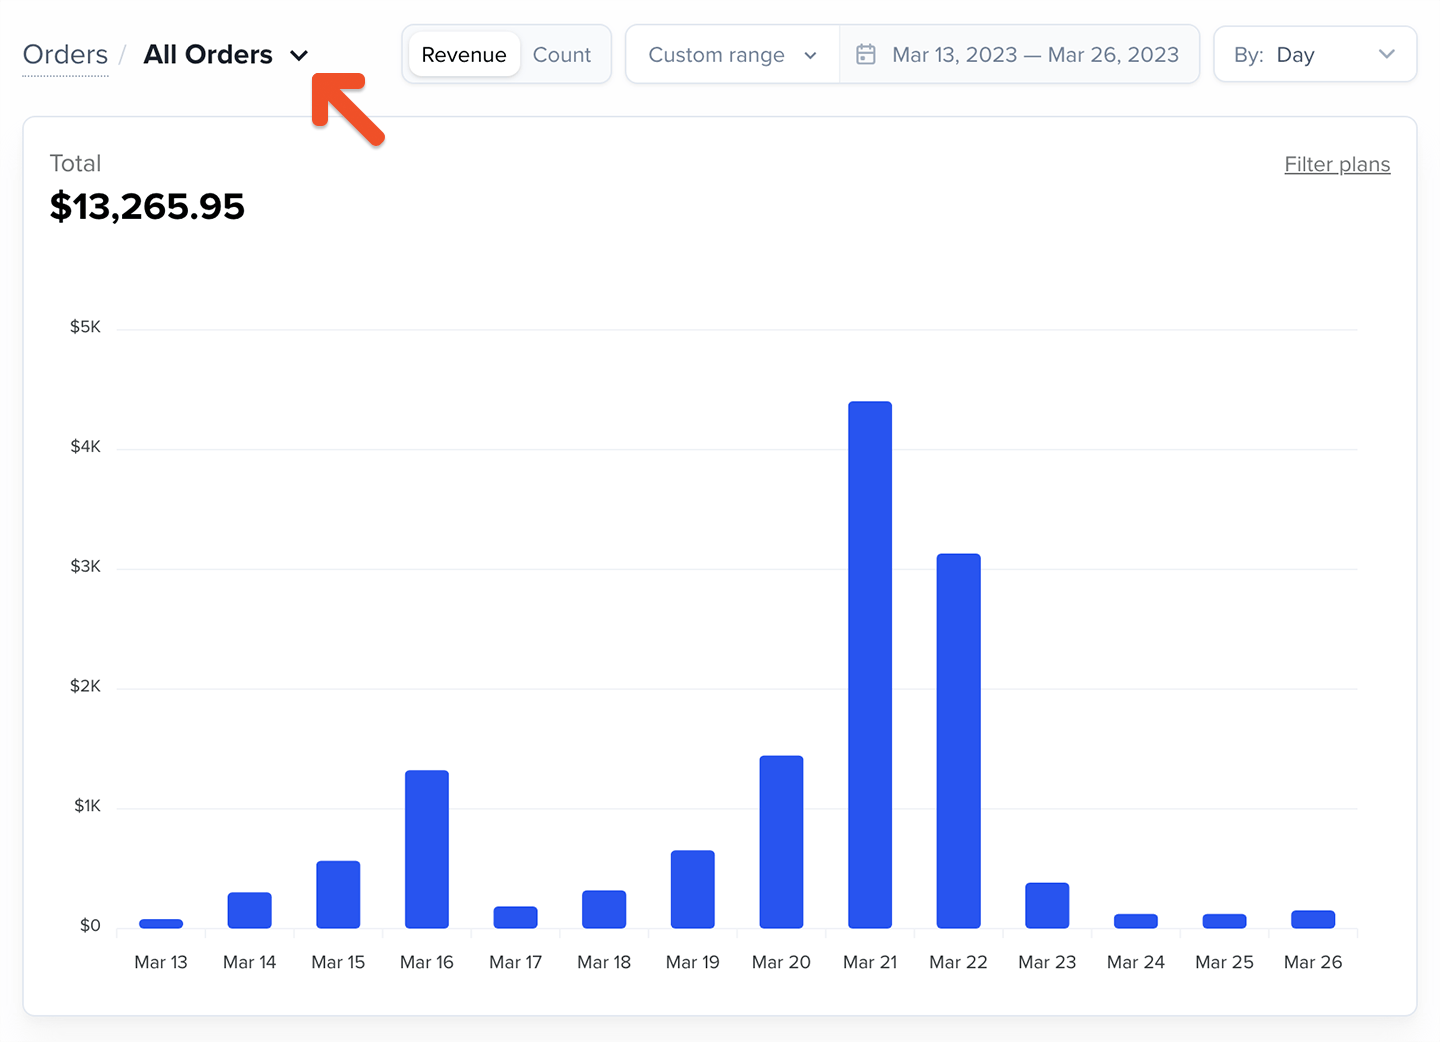
All orders
The All Orders chart tracks total revenue or total count over your selected period. This includes:- New orders
- Renewals
- Reactivations (even if on a different plan)
- Upgrades
- Additional seats for group subscriptions
- Standalone purchases
- External payments
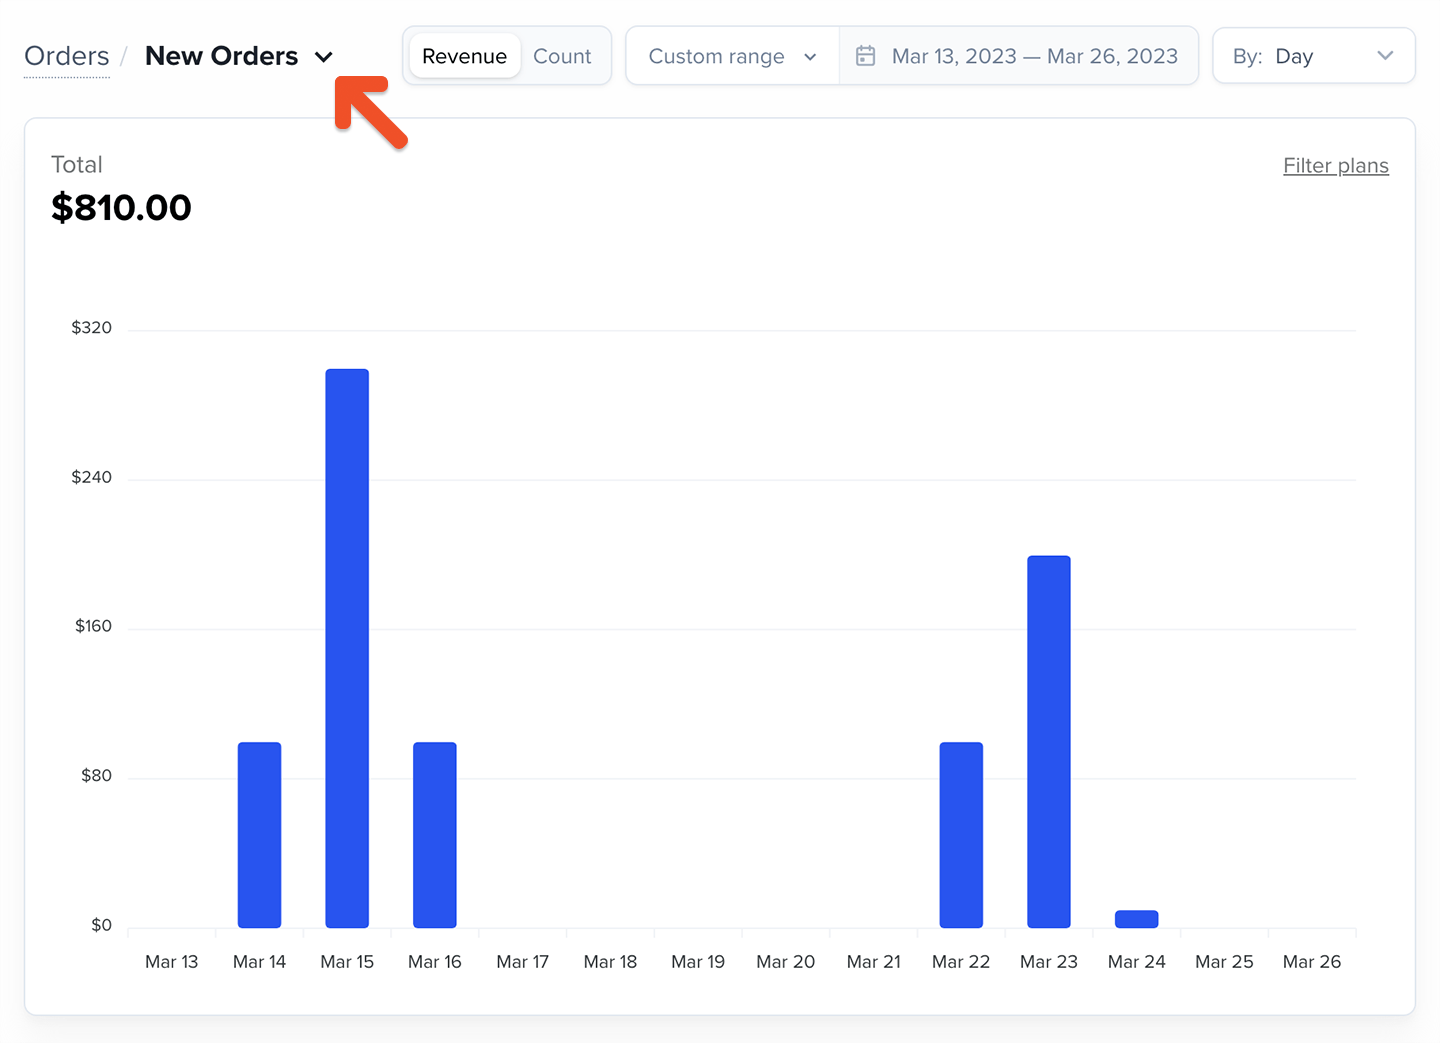
New orders
The New Orders chart tracks all first-time purchases, including:- Plan purchases
- Gift purchases
- Trial starts
Renewals
The Renewals chart tracks recurring subscription renewals, including trials that convert into active subscriptions. Subscriptions renew based on the exact time they started. For example, a monthly subscription that began on June 8 at 7:56 AM (UTC) will renew after it reaches July 8 at 7:56 AM (UTC). Renewals are processed in batches, so a subscription might not renew at the exact renewal time, but it should update shortly thereafter.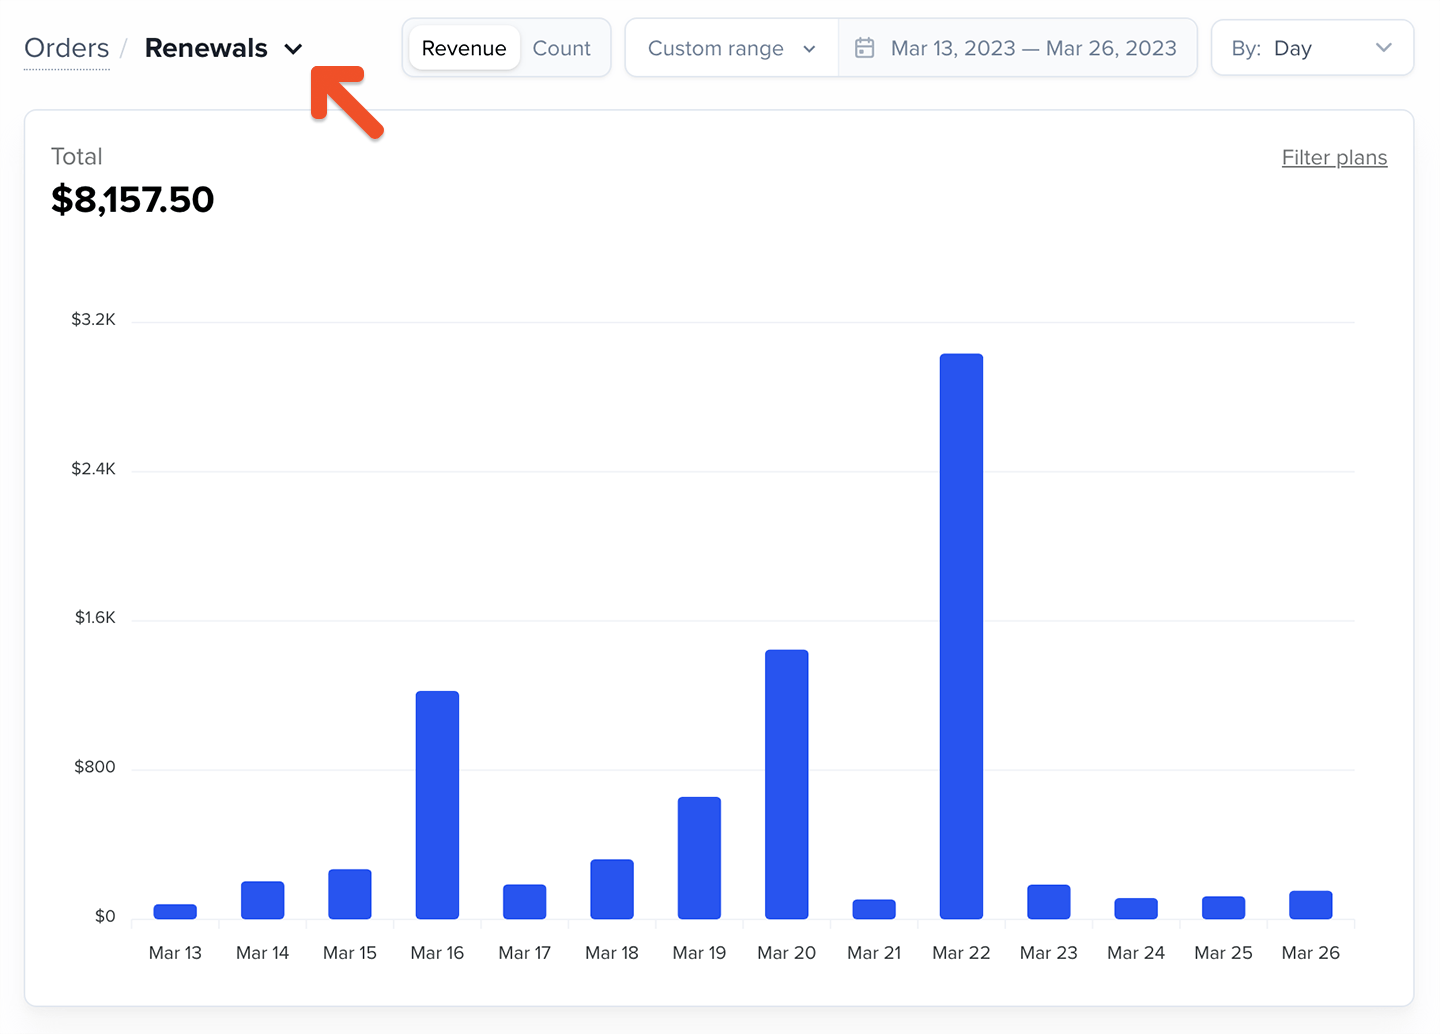
Reactivations
The Reactivations chart tracks recurring subscriptions that were previously expired or canceled, including upgrades into a new plan.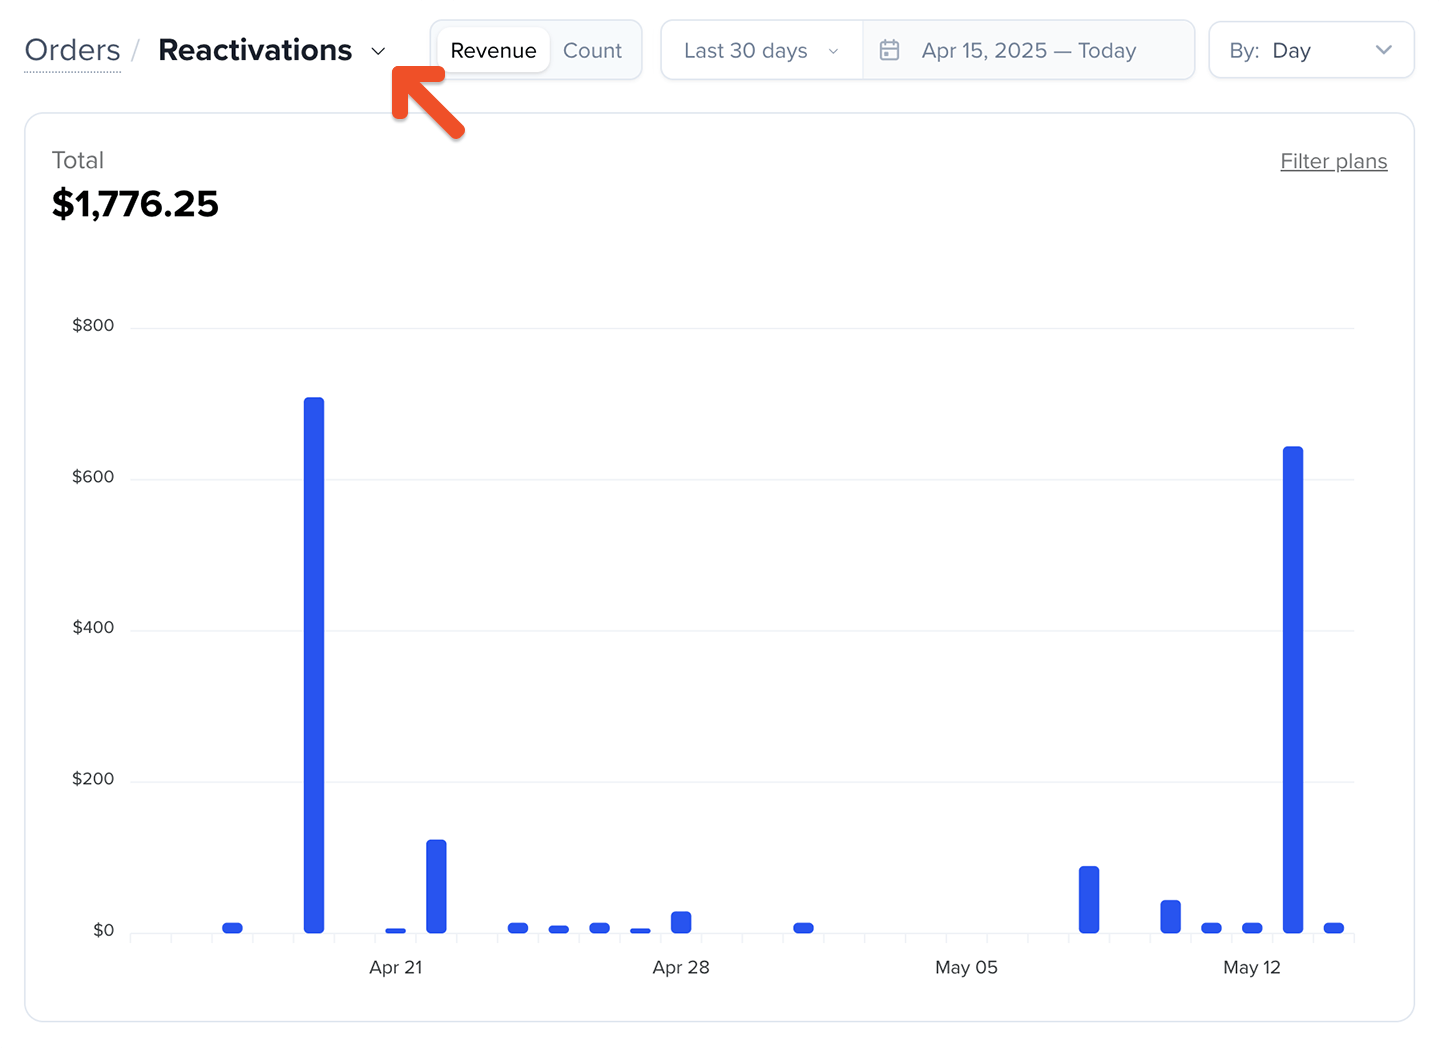
Gifts
The Gifts chart tracks the count or revenue from gift purchases over your selected date range.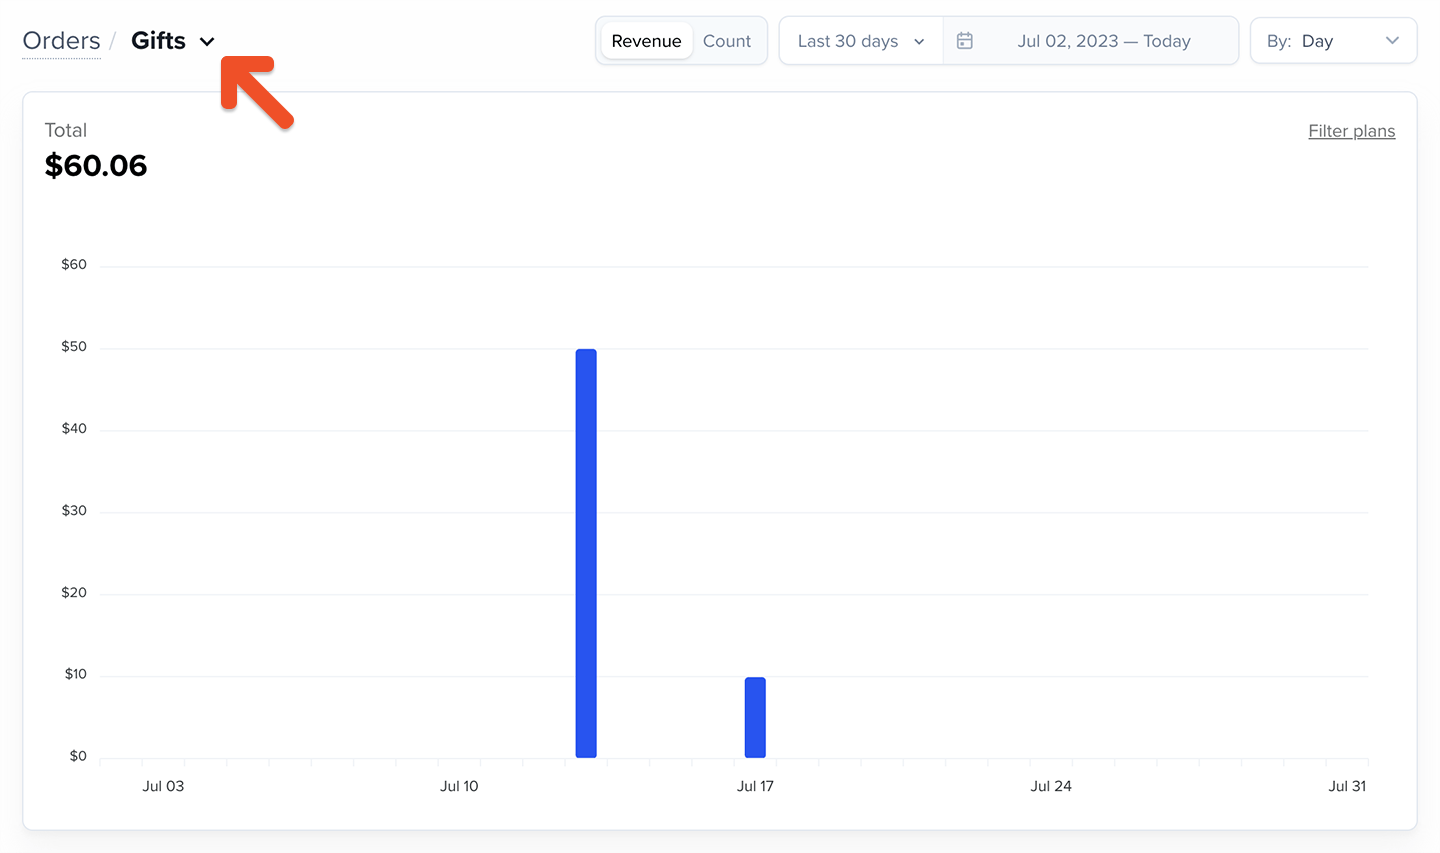
Refunds
The Refunds chart tracks all processed refunds.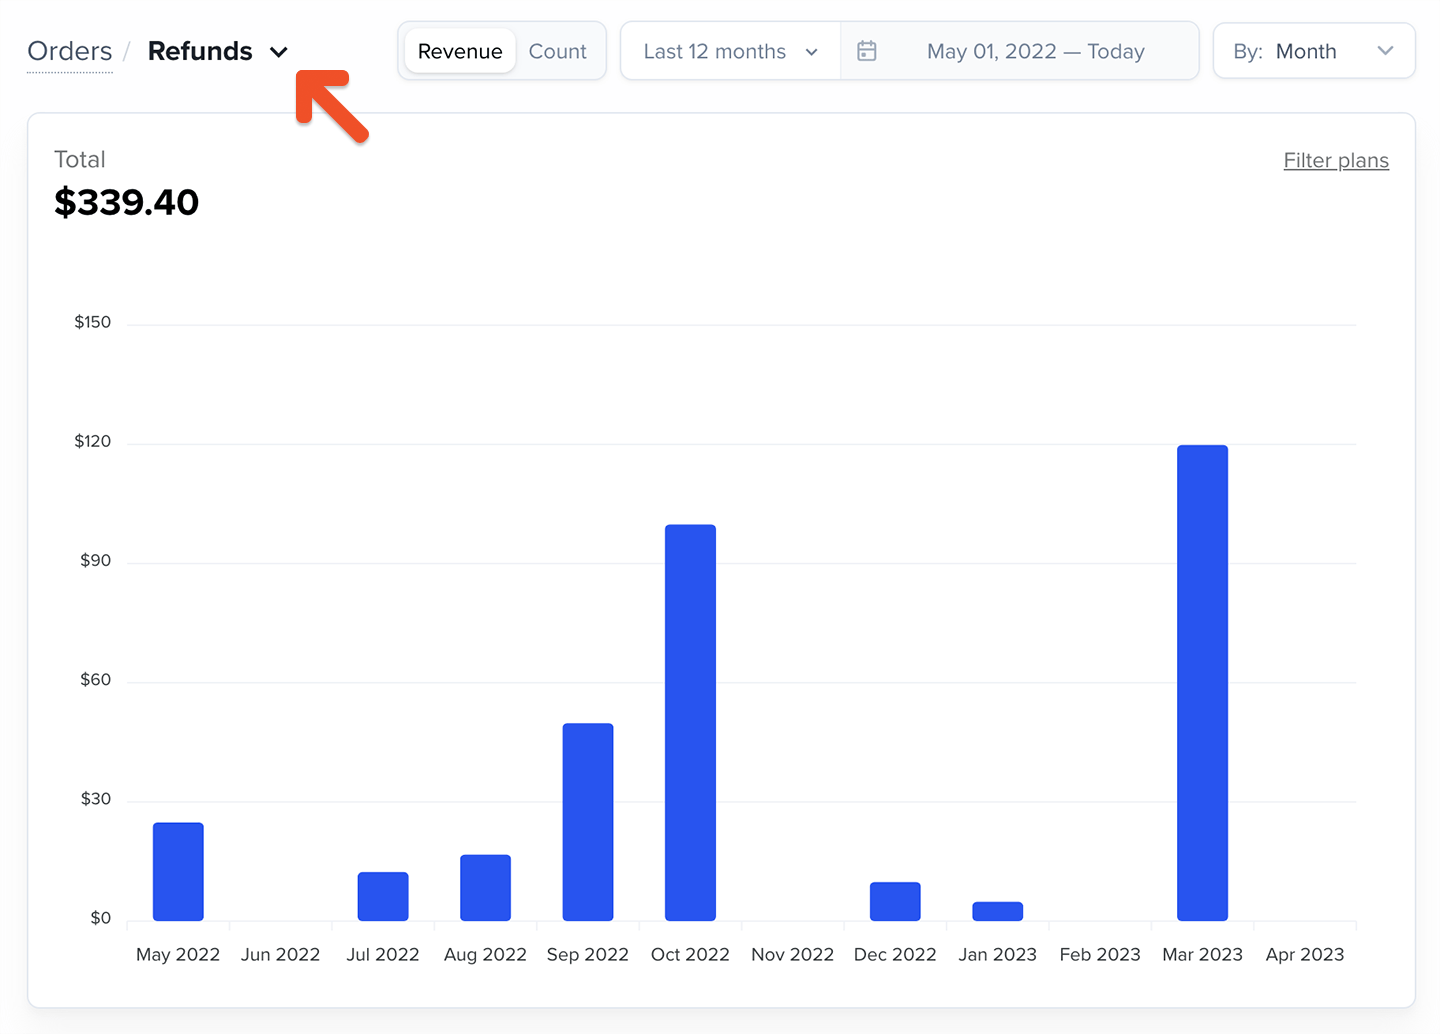
When order data updates
- Most order data appears within a few minutes of processing.
- Historical data (yesterday) finalizes at 00:00 UTC.
- If your selected date range includes today, the chart will refresh on demand when opened and continue updating every few minutes.