> ## Documentation Index
> Fetch the complete documentation index at: https://memberful.com/docs/llms.txt
> Use this file to discover all available pages before exploring further.
# Track net revenue
> Getting clarity on your net revenue will help you understand the health of your business and gives you the foundation to calculate profit margins.
export const RelatedDocs = ({link1, link2, link3, link4, link5, link6, link7, link8, link9, link10, className = ""}) => {
const links = [link1, link2, link3, link4, link5, link6, link7, link8, link9, link10].filter(Boolean);
if (!links.length) return null;
return ;
};
As a membership business, you want to ensure that your pricing remains profitable — especially when you offer discounts, test new products, or evaluate how refunds impact your bottom line.
In this help article, we'll show you how Net Revenue works, how it’s calculated, and how to use it to understand the long-term performance of your business.
## Where to find this metric
Go to *Revenue → Metrics → Net Revenue* in your Memberful dashboard.
## What is net revenue?
Revenue is the total amount your business earns from sales.
Net revenue is your total sales revenue minus refunds and member discounts. It represents the actual amount you keep from sales *before* any operating expenses (e.g., software costs, production expenses, or team costs).
Net revenue is important because refunds and discounts can meaningfully change your monthly earnings — and understanding these changes helps you make informed pricing and product decisions.
## How is Net Revenue calculated?
Here's how we calculate the Net Revenue metric:
`Net Revenue = Total Revenue - Refunds - Discounts`
We calculate Net Revenue by subtracting all refunds and membership discounts from your total revenue (orders).
Metrics update daily at midnight UTC and reflect the previous calendar day.
## What affects my Net Revenue?
These activities affect your Net Revenue:
* **Orders:** Revenue from all recurring and one-time payments
* **Refunds:** Revenue lost due to full or partial refunds
* **Discounts:** Revenue reduced by coupon codes, membership discounts, or promotional pricing
## How to explore your Net Revenue data
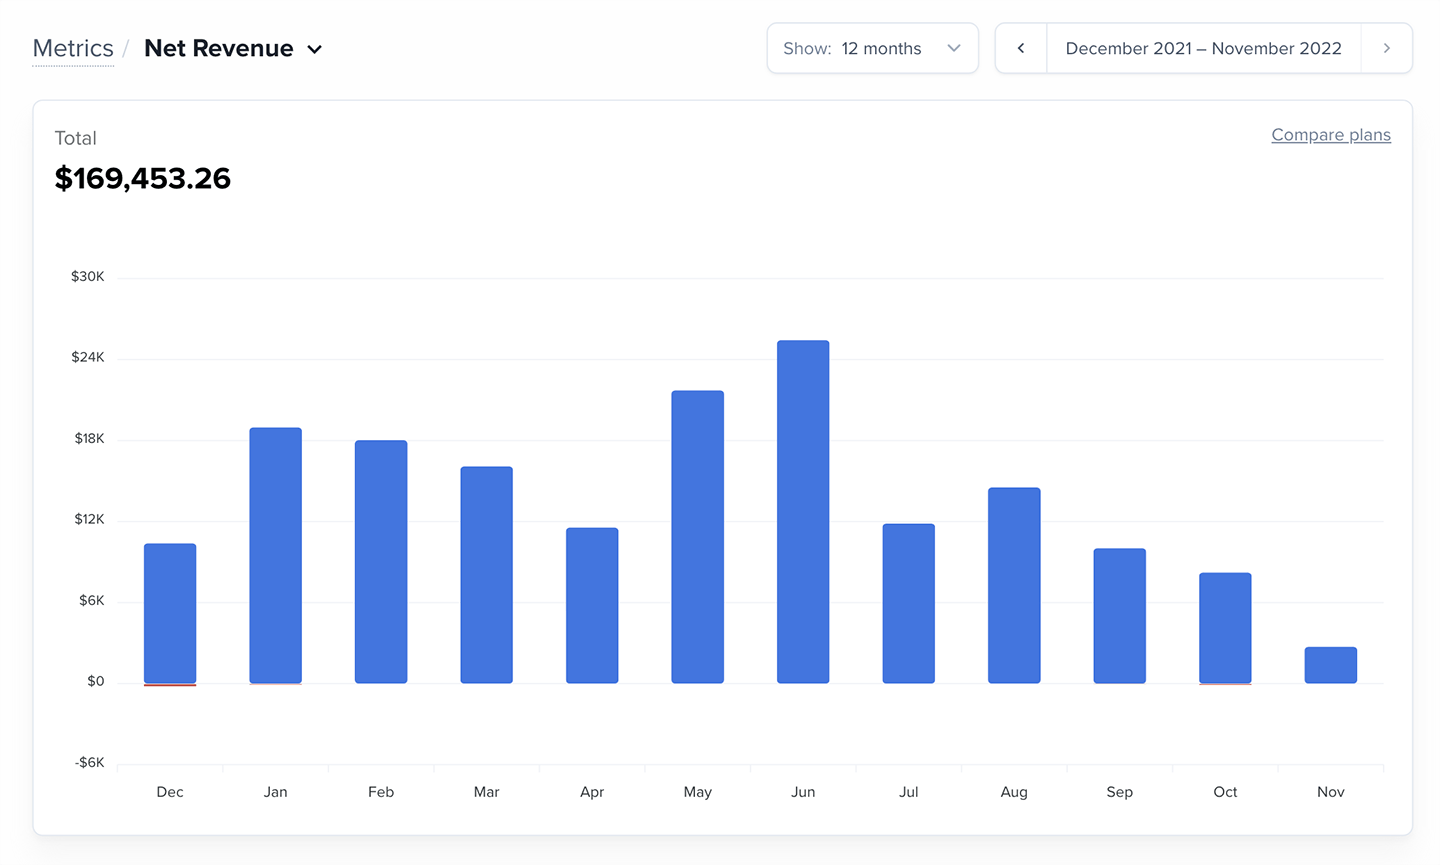
The Net Revenue chart displays your monthly totals, including the current (partially complete) month. It defaults to the last 12 months, but you can switch to the last 3 or 6 months, or scroll forward and backward through time.
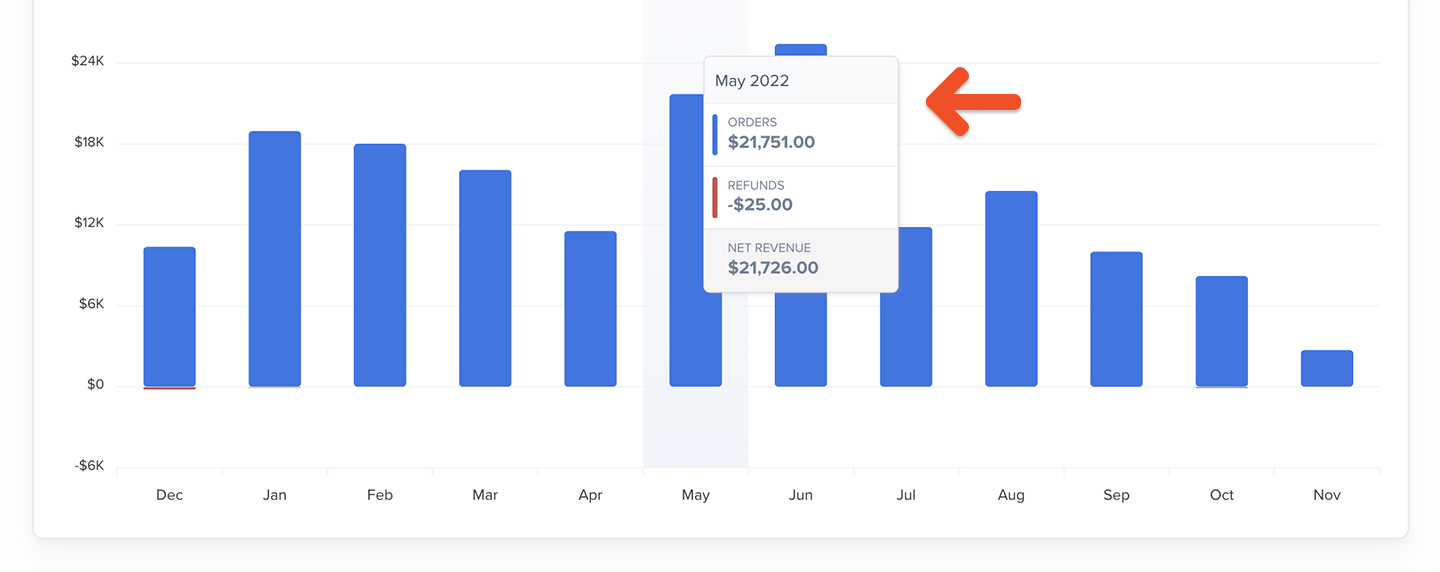
 Hover over any bar to see the breakdown of orders, refunds, and discounts for that month. You can also switch to the table view for a clearer month-by-month comparison.
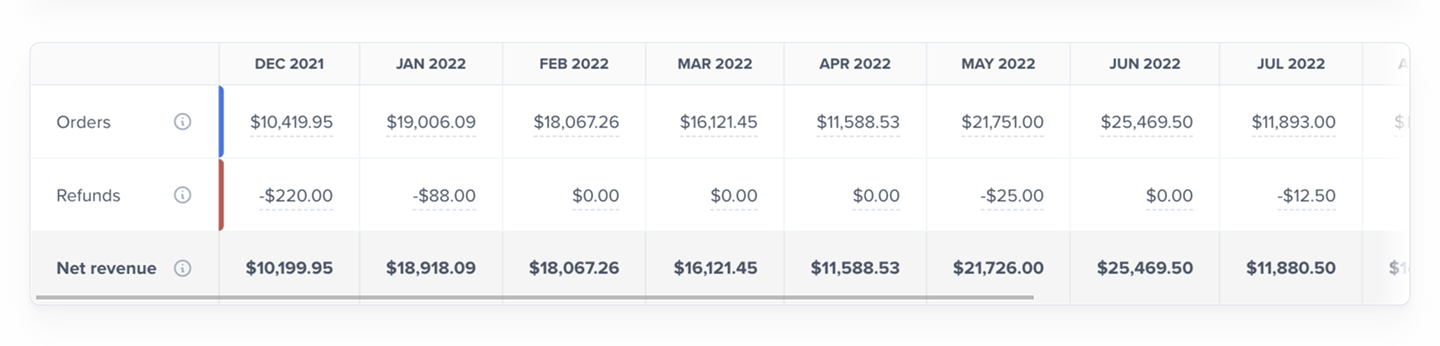
 Below the graph, you’ll see a table that lists each segment (orders, refunds, discounts) for every calendar month.
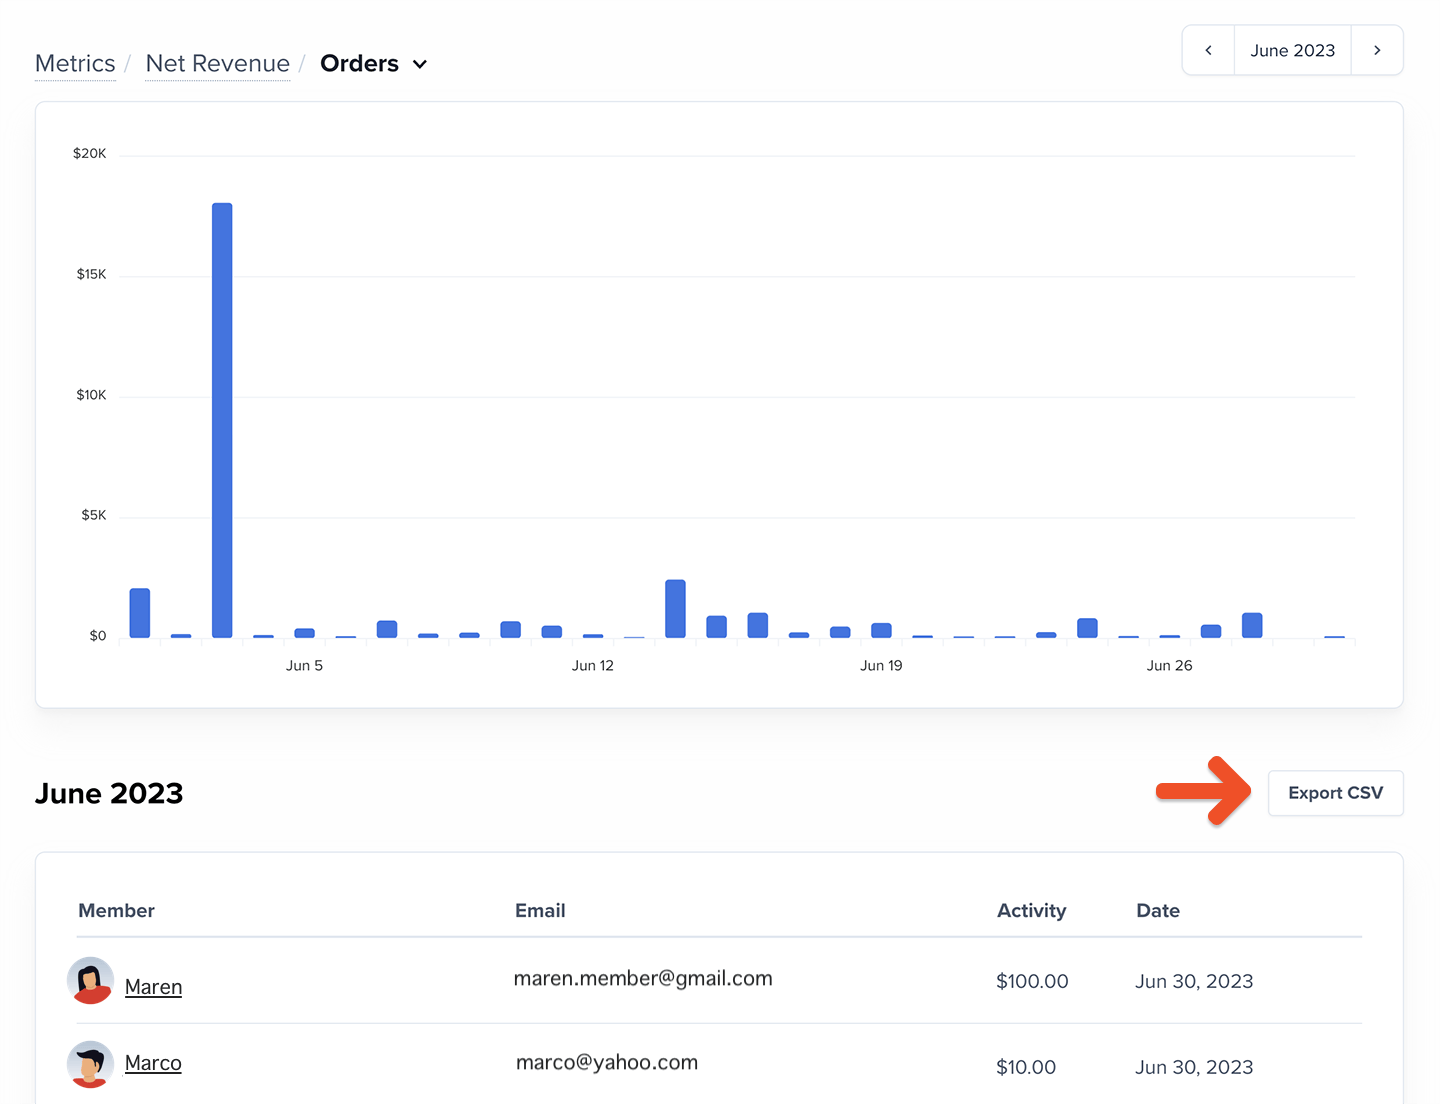
 Click any value to view the individual data points contributing to that total. You can also export these details.
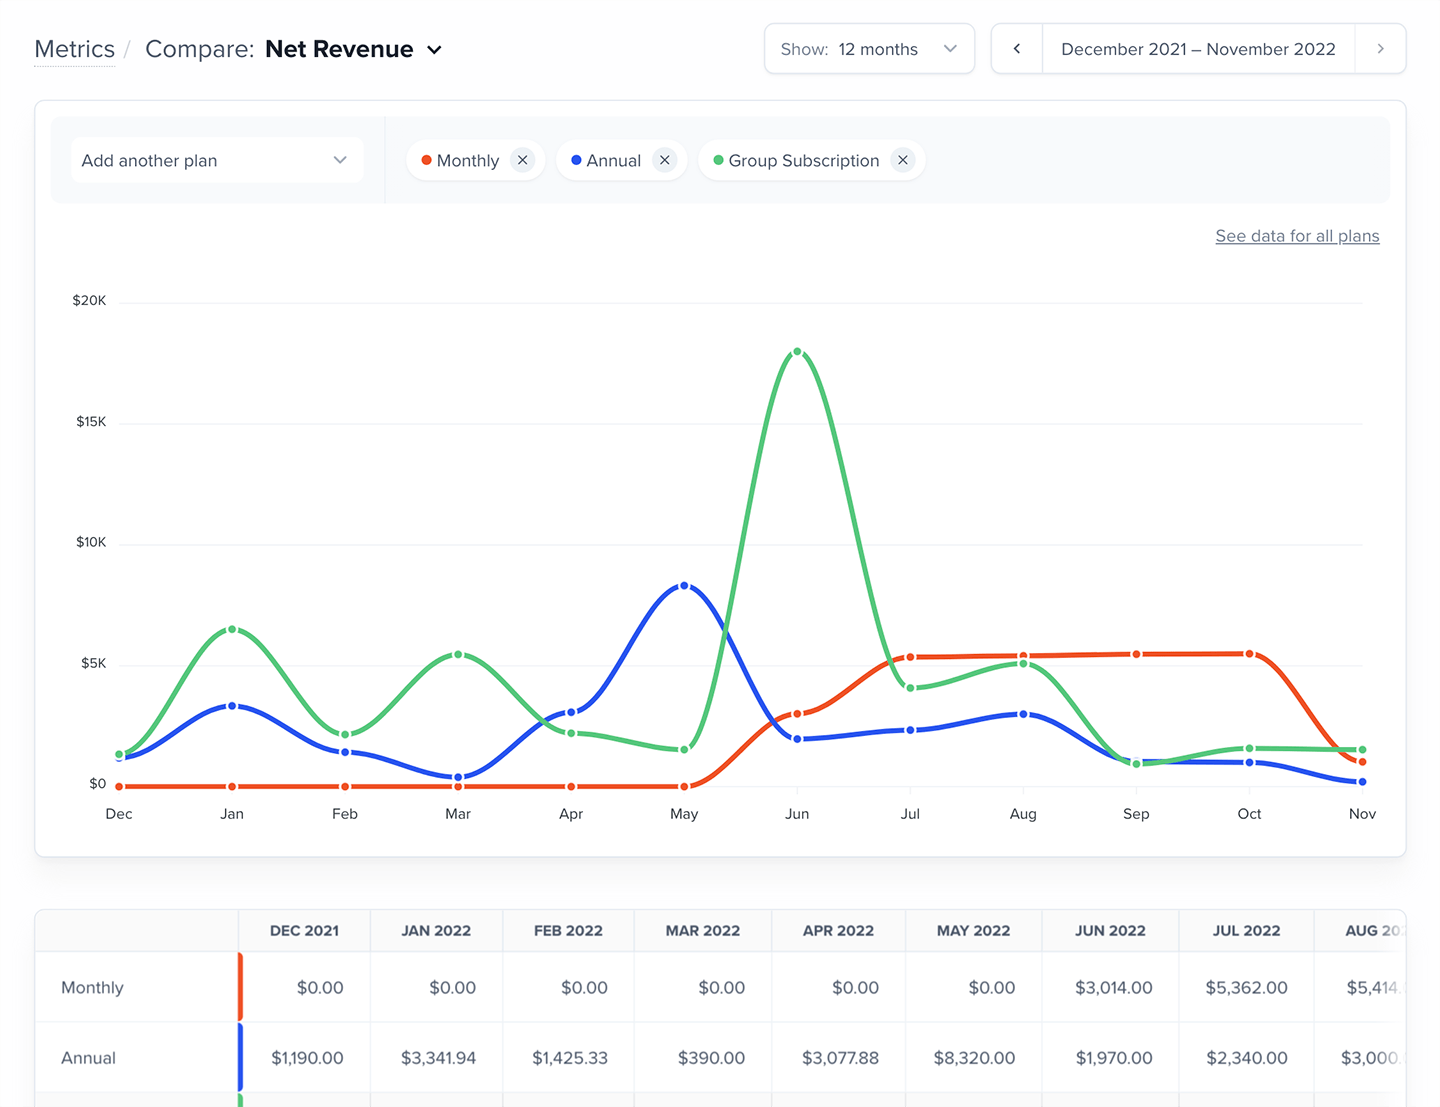
 Want to compare Net Revenue across plans? [Learn more.](/metrics-and-analytics/compare-and-export/plan-comparison/)
 ## How should I use this metric?
Net Revenue gives you a clearer picture of your true earnings after refunds and discounts — which is essential for understanding how your business is performing month over month.
From here, you can subtract additional operating expenses to calculate your **net profit**, or use Net Revenue to track your **profit margins** over time.
A few patterns to monitor:
* **Net revenue trending upward**: Your earnings are growing and discounts/refunds are under control
* **Net revenue trending downward**: Refunds, discounts, or pricing issues may be eating up your earnings
* **A shift lasting 3+ months**: A sustained trend worth investigating
It’s normal for net revenue to fluctuate, but long-term patterns reveal whether your membership is strengthening or weakening.
## How should I use this metric?
Net Revenue gives you a clearer picture of your true earnings after refunds and discounts — which is essential for understanding how your business is performing month over month.
From here, you can subtract additional operating expenses to calculate your **net profit**, or use Net Revenue to track your **profit margins** over time.
A few patterns to monitor:
* **Net revenue trending upward**: Your earnings are growing and discounts/refunds are under control
* **Net revenue trending downward**: Refunds, discounts, or pricing issues may be eating up your earnings
* **A shift lasting 3+ months**: A sustained trend worth investigating
It’s normal for net revenue to fluctuate, but long-term patterns reveal whether your membership is strengthening or weakening.