> ## Documentation Index
> Fetch the complete documentation index at: https://memberful.com/docs/llms.txt
> Use this file to discover all available pages before exploring further.
# Track MRR
> Track Monthly Recurring Revenue (MRR) in Memberful to see the predictable revenue your active subscriptions generate each month and how it changes over time.
export const RelatedDocs = ({link1, link2, link3, link4, link5, link6, link7, link8, link9, link10, className = ""}) => {
const links = [link1, link2, link3, link4, link5, link6, link7, link8, link9, link10].filter(Boolean);
if (!links.length) return null;
return ;
};
MRR helps you understand the stability of your recurring revenue and how it changes over time. Because this metric only includes recurring payments, it gives you a clear signal of long-term membership performance separate from one-time sales or fixed-term payments.
In this help article, we’ll explain how MRR works, how it’s calculated, what affects it, and how to use this metric to understand the growth and retention of your membership.
## Where to find this metric
Go to *Revenue → Metrics → Monthly Recurring Revenue* in your Memberful dashboard.
## What is MRR?
Monthly Recurring Revenue (MRR) represents all active recurring subscription revenue normalized to a monthly amount. It includes:
* Monthly recurring plans
* Quarterly or annual recurring plans (converted to a monthly equivalent)
* Recurring plans with ongoing discounts
MRR does not include:
* One-time payments
* Fixed-length subscriptions
* Gift purchases (unless the recipient renews into a recurring plan)
MRR provides a reliable baseline for forecasting, understanding trends, and making pricing and retention decisions.
## How is MRR calculated?
**MRR increases when:**
* A member begins paying for a recurring plan
* A member upgrades to a higher recurring price
* A coupon ends and renewals increase
* A group subscription adds seats
* A choose-what-you-pay amount increases
**MRR decreases when:**
* A member downgrades to a lower price
* A group removes seats
* A recurring discount is added
* A member cancels
* A renewal fails and cannot be collected within 30 days
MRR is counted when the member pays for their **first full term** after any trial (free or paid).
**Examples**:
* \$10/mo plan → contributes \$10 MRR
* \$100/year plan → contributes \$8.33 MRR
* \$10/mo plan with a \$5 recurring coupon → contributes \$5 MRR
Metrics update daily at midnight UTC and reflect the previous calendar day.
## What affects my MRR?
MRR is grouped into segments that show how recurring revenue changes throughout the month:
* **Starting**: Recurring revenue active at the beginning of the month
* **New members**: Members who began recurring payments for the first time
* Gift recipients count as “new” only when they renew into a recurring plan
* **Reactivations**: Members returning to a recurring plan after a prior cancellation
* **Upgrades**: Members whose recurring payments increased
* May be due to plan changes, added seats, coupon expirations, or increased choose-what-you-pay amounts
* **Downgrades**: Members whose recurring payments decreased
* May be due to fewer seats, added recurring coupons, or reduced choose-what-you-pay amounts
* **Cancellations**: Members who ended recurring payments
* **Failed payments**: Recurring revenue lost when payment could not be collected within 30 days
## How to explore your MRR data
The MRR chart shows monthly changes in total recurring revenue, including the current (partially complete) month. You can view the last 3, 6, or 12 months.
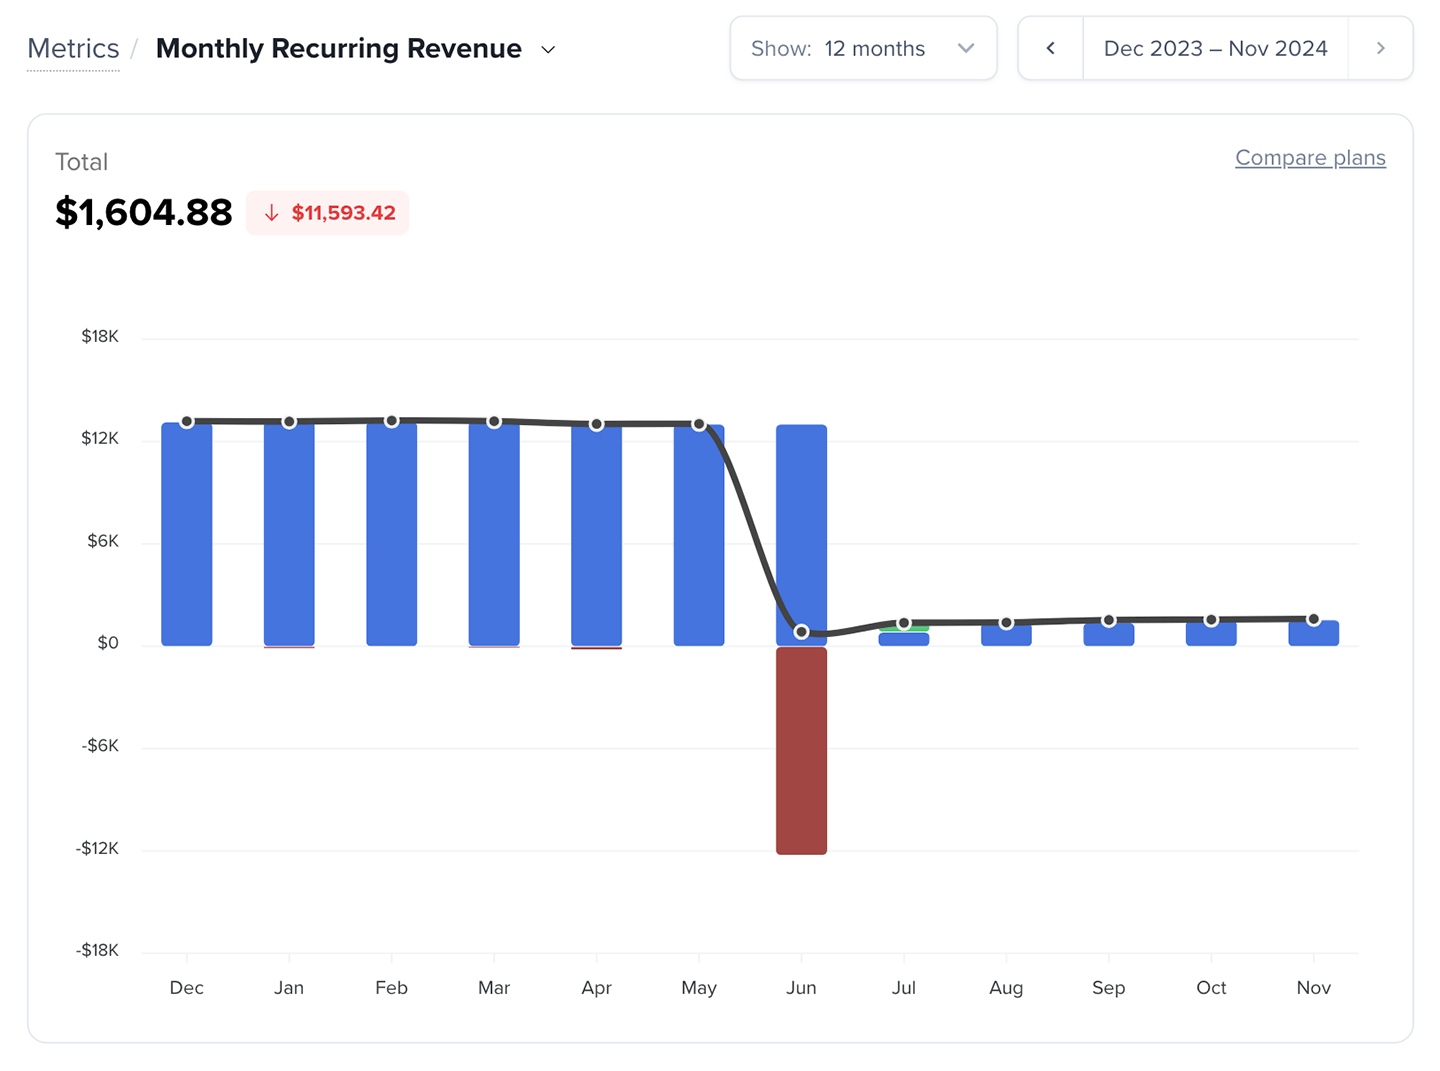 The stacked bars show all increases and decreases contributing to your MRR for that month.
The line overlaid on the chart shows net MRR after all changes are factored in.
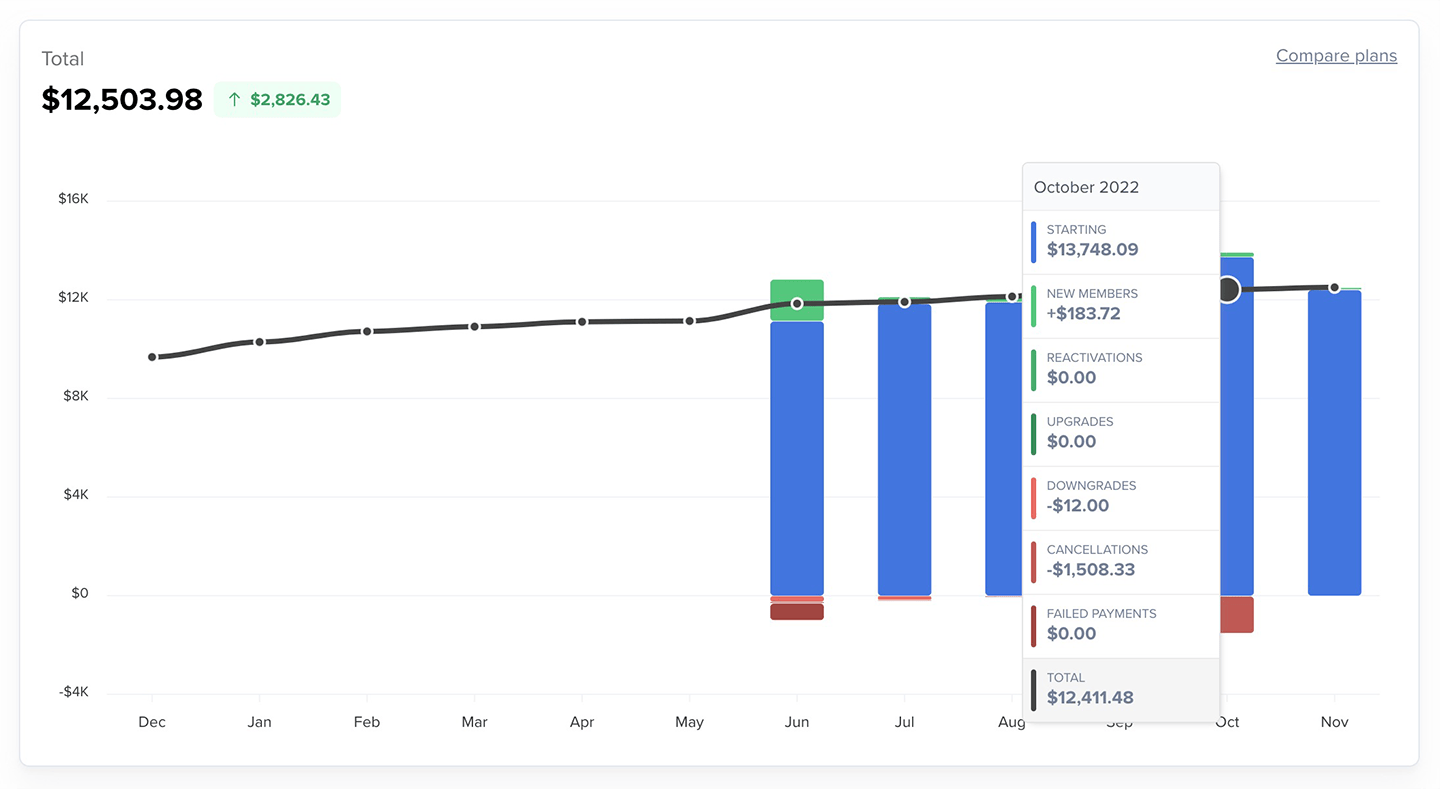
Hover over any bar for a detailed breakdown of segment changes.
The stacked bars show all increases and decreases contributing to your MRR for that month.
The line overlaid on the chart shows net MRR after all changes are factored in.
Hover over any bar for a detailed breakdown of segment changes.
 Want to compare MRR across plans? [Learn more.](/metrics-and-analytics/compare-and-export/plan-comparison/)
Below the chart, you’ll find a table showing monthly segment values, along with:
* Recurring payments active at month end
* Total paying members (members with recurring payments active)
* Average revenue per member (ARPM)
Want to compare MRR across plans? [Learn more.](/metrics-and-analytics/compare-and-export/plan-comparison/)
Below the chart, you’ll find a table showing monthly segment values, along with:
* Recurring payments active at month end
* Total paying members (members with recurring payments active)
* Average revenue per member (ARPM)
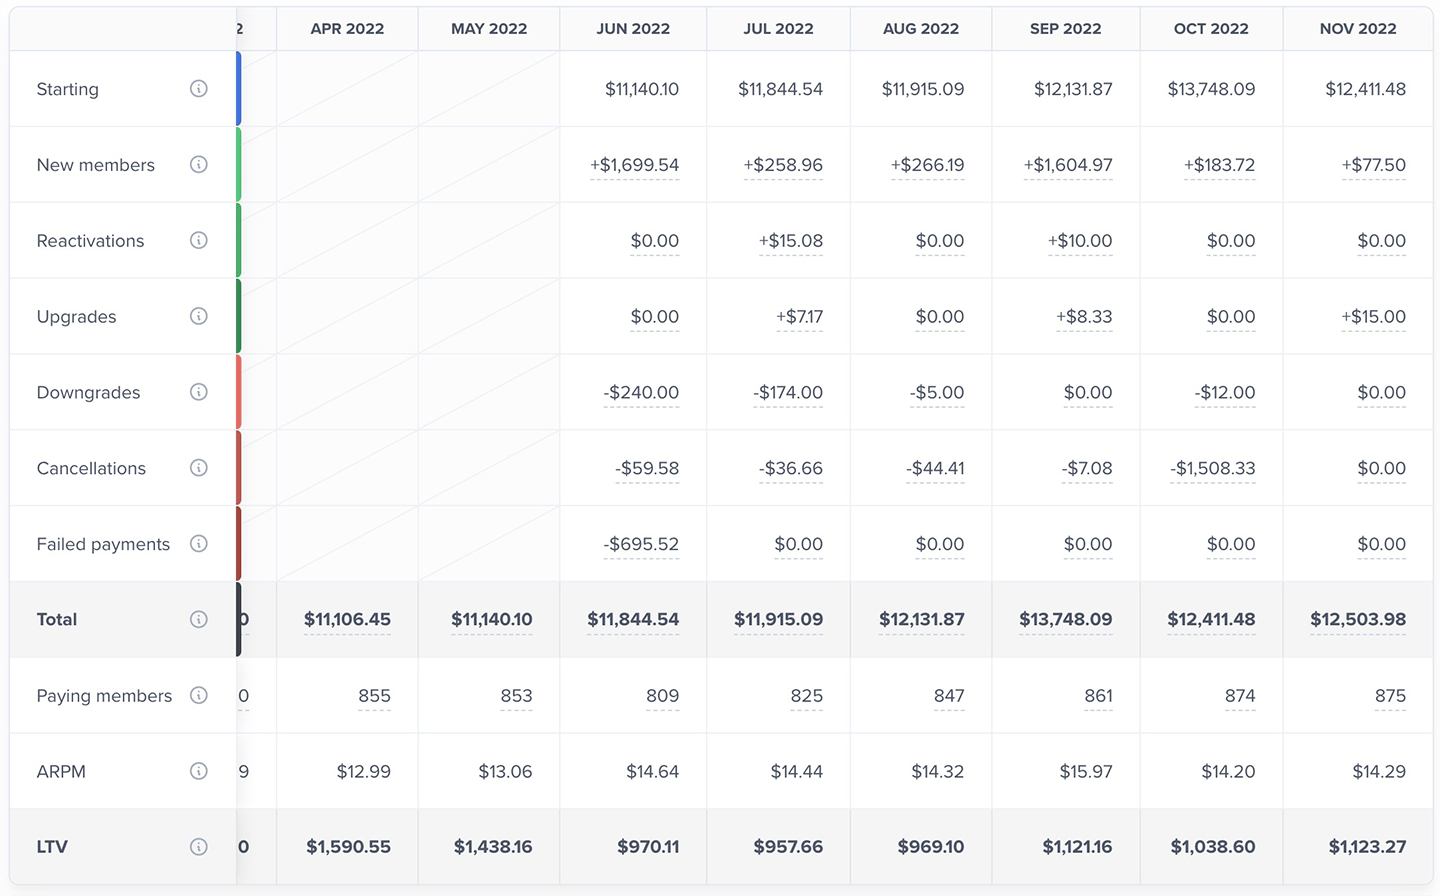 Click any non-total cell to view the daily activity for that month. You can export this list.
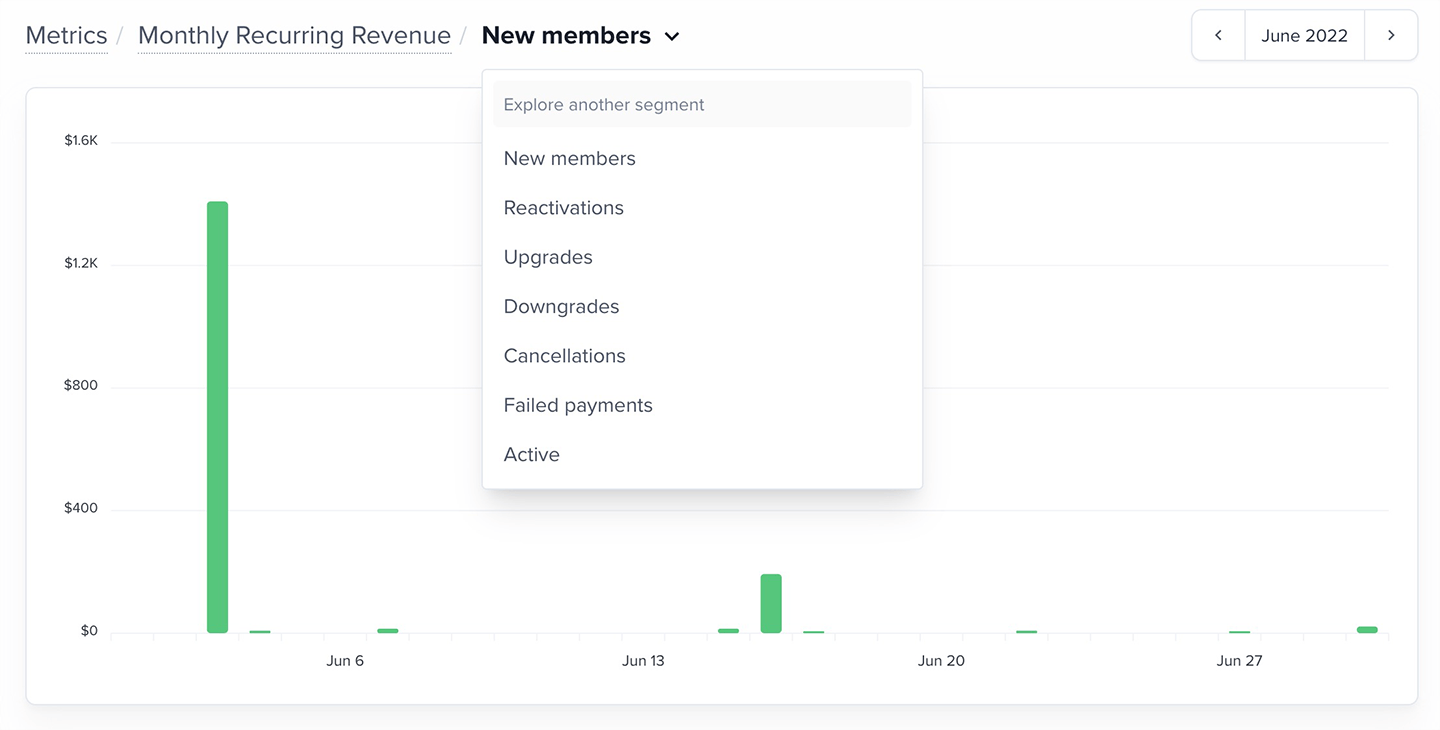
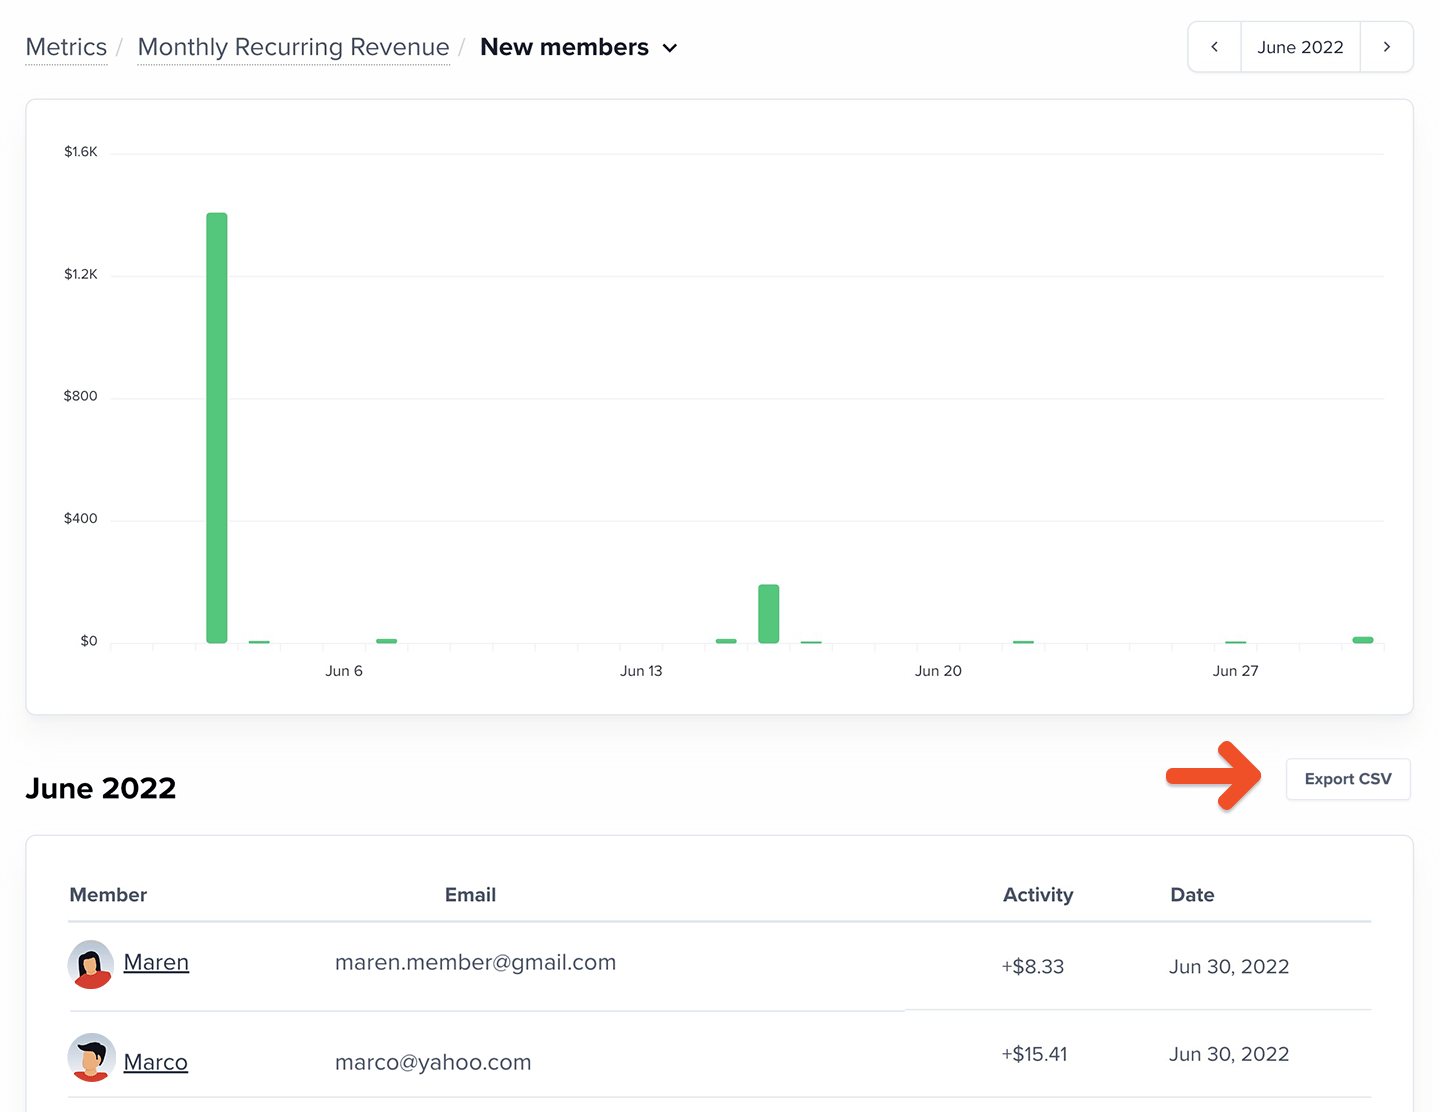 You can switch the displayed segment or change the month using the dropdown.
 ### Lifetime value (LTV)
LTV helps you understand the long-term value of each recurring member and how much you can sustainably spend to acquire new members.
LTV is calculated as:
`LTV = ARPM ÷ Trailing 12-month Average Member Churn Rate`
### Lifetime value (LTV)
LTV helps you understand the long-term value of each recurring member and how much you can sustainably spend to acquire new members.
LTV is calculated as:
`LTV = ARPM ÷ Trailing 12-month Average Member Churn Rate`
 ## How should I use this metric?
MRR helps you understand the long-term health of your subscription revenue. You can use MRR to:
* See how much recurring revenue you can expect next month
* Understand whether revenue growth comes from new members or existing members
* Track the impact of pricing changes
* Monitor how cancellations and failed payments affect recurring revenue
* Identify when you’re over-reliant on a single plan or segment
## Ways to increase MRR
### Offer longer billing cycles
Quarterly and annual plans reduce the number of renewal events, which often decreases churn and increases MRR stability.
### Review pricing regularly
If your offering is undervalued, a thoughtful price increase can strengthen long-term revenue. [Learn how to navigate price increases.](https://memberful.com/blog/price-increases/)
### Encourage plan upgrades
Highlight higher-tier offerings, group plan options, or choose-what-you-pay flexibility to increase recurring revenue from existing members.
## How should I use this metric?
MRR helps you understand the long-term health of your subscription revenue. You can use MRR to:
* See how much recurring revenue you can expect next month
* Understand whether revenue growth comes from new members or existing members
* Track the impact of pricing changes
* Monitor how cancellations and failed payments affect recurring revenue
* Identify when you’re over-reliant on a single plan or segment
## Ways to increase MRR
### Offer longer billing cycles
Quarterly and annual plans reduce the number of renewal events, which often decreases churn and increases MRR stability.
### Review pricing regularly
If your offering is undervalued, a thoughtful price increase can strengthen long-term revenue. [Learn how to navigate price increases.](https://memberful.com/blog/price-increases/)
### Encourage plan upgrades
Highlight higher-tier offerings, group plan options, or choose-what-you-pay flexibility to increase recurring revenue from existing members.